
简介
- 简介
- graphviz 历史
- 在线运行Graphviz
- 下载安装使用 graphviz
- graphviz_python库教程
- 图的集合
- Digraph有向图
- Digraph方法集合
- Digraph属性集合
- Digraph 有向图_简单绘图_1
- Digraph 有向图_简单绘图_2
- Digraph 有向图_集群_3
- Digraph 有向图_实例关系ER图_4
- Digraph 有向图_迭代继承图_5
- Digraph 有向图_数据结构图_6
- Digraph 有向图_数据结构快速原型图_7
- Digraph 有向图_二叉树图_8
- Digraph 有向图_环图_9
- Digraph 有向图_集群有向图_10
- Graph无向图
- 安卓状态机图形
graphviz 历史
Graphviz 或 Graph Visualization 是由
【 AT&T 】 开发的一个开源的图形可视化工具, 提供了dot语言来编写绘图脚本,
可以很方便的绘制想要的设计图,通过本文你可以基本掌握Graphviz工具的时候,
能够灵活的绘制出自己想要的UML类图


用于绘制DOT语言脚本描述的图形。它也提供了供其它软件使用的库。
Graphviz是一个自由软件,其授权为Eclipse Public License。
其Mac版本曾经获得2004年的苹果设计奖。


是贝尔实验室几个计算机牛人设计的一个开源 的图表(计算机科学中数据结构中的图)
可视化项目,主要用C语言实现,主要实现了一些图布局算法。
通过这些算法,可以将图中的节点在画布上比较均匀的分 布,缩短节点之间的边长,并且尽量的减少边的交叉。


Graphviz 提供命令式的绘图方式,它提供一个dot语言 用来编写绘图脚本,然后对这个脚本进行解析,
分析出其中的定点,边以及子图,然后根据属性进行绘制。
Graphviz 的理念和一般的“所见即所得”的画图工具不一样,是“所想即所得”。
Graphviz提供了dot语言来编写绘图脚本,dot语言是非常简单


CMD下输入命令 确认是否生效
dot -version

https://chungkwong.github.io/dot.html

配置地址:
https://www.cnblogs.com/BlameKidd/p/9762046.html


https://blog.csdn.net/bxh7425014/article/details/51142464
graphviz 学习
在线运行Graphviz
https://dreampuf.github.io/GraphvizOnline/
https://graphviz.readthedocs.io/en/stable/ Graphviz教程地址
下载安装使用 graphviz
下载地址:
http://www.ddooo.com/softdown/62108.htm#dltab

安装路径: C:\Program Files (x86)\Graphviz2.38\

在用户变量的“path”里添加
C:\Program Files (x86)\Graphviz2.38\bin\


在系统变量的“path”里添加
C:\Program Files (x86)\Graphviz2.38\bin\dot.exe
测试安装结果
CMD下输入命令 确认是否生效
dot -version


C:\Users\aaa>dot -version
dot - graphviz version 2.38.0 (20140413.2041)
libdir = "C:\Program Files (x86)\Graphviz2.38\bin"
Activated plugin library: gvplugin_dot_layout.dll
Using layout: dot:dot_layout
Activated plugin library: gvplugin_core.dll
Using render: dot:core
Using device: dot:dot:core
The plugin configuration file:
        C:\Program Files (x86)\Graphviz2.38\bin\config6
                was successfully loaded.
    render      :  cairo dot fig gd gdiplus map pic pov ps svg tk vml vrml xdot
    layout      :  circo dot fdp neato nop nop1 nop2 osage patchwork sfdp twopi
    textlayout  :  textlayout
    device      :  bmp canon cmap cmapx cmapx_np dot emf emfplus eps fig gd gd2 gif gv imap imap_np ismap jpe jpeg jpg metafile pdf pic plain plain-ext png pov ps ps2 svg svgz tif tiff tk vml vmlz vrml wbmp xdot xdot1.2 xdot1.4
    loadimage   :  (lib) bmp eps gd gd2 gif jpe jpeg jpg png ps svg
pycharm中使用 graphviz
1.CMD 下输入命令安装graphviz   pip install graphviz


2. 重启电脑 让 配置生效
3. 打开 pycharm   安装 graphviz
file 》  setting 》 Project Interpreter 》 + 》 输入 graphviz 搜索 》install安装


4. 创建python 工程 导入包  from graphviz import Digraph;  开始编写 图形代码
pycharm中使用 graphviz简单测试运行
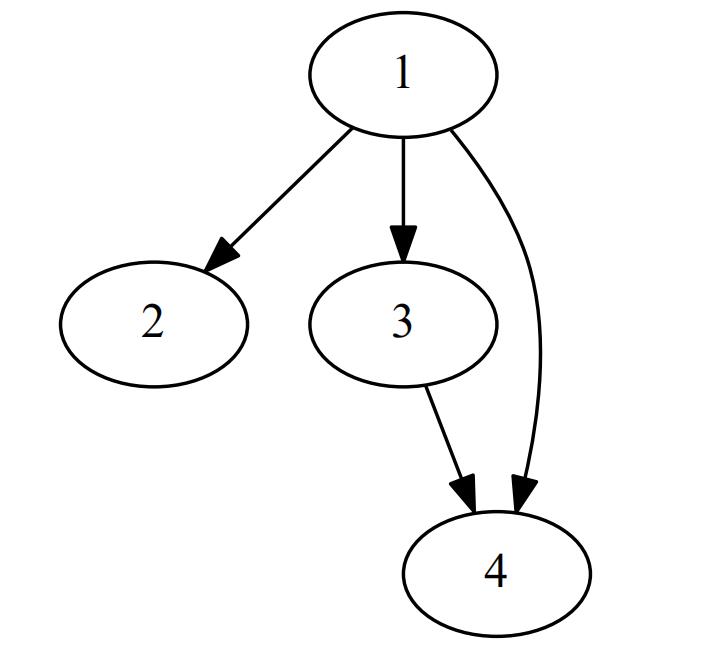
from graphviz import Digraph;

if __name__ == '__main__':
    B = Digraph('G',filename='test1.gv');
    B.edge('1','2');
    B.edge('1','3');
    B.edge('1','4');
    B.edge('3','4');
    B.view();
dot命令使用
在CMD 下 输入   gvedit   打开绘图界面  gvedit


test.gv
digraph {
   size = "80, 80";
   A [label="Dot A"]
   B [label="Dot B"]
   C [label="Dot C"]
   A -> B
   A -> C
   B -> C [label=test]
}


dot  "<filename>" -Tpng -o <filename.png>

dot  ./test.gv -Tpng -o 1.png    // 对该gv文件生成 png图片
dot  ./test.gv -Tpdf -o 1.pdf    // 对该gv文件生成 pdf文件
graphviz_python库教程
图的集合
__all__ = [
    'Graph', 'Digraph',
    'Source',
    'nohtml',
    'render', 'pipe', 'version', 'view',
    'ENGINES', 'FORMATS', 'RENDERERS', 'FORMATTERS',
    'ExecutableNotFound', 'RequiredArgumentError',
]
Digraph有向图
Digraph方法集合
Digraph(comment=’xxx’)
Digraph(comment='xxx') 有向图构造函数  创建有向图

def __init__(self, name=None, comment=None,
             filename=None, directory=None,
             format=None, engine=None, encoding=files.File._encoding,
             graph_attr=None, node_attr=None, edge_attr=None, body=None,
             strict=False):

"""有向图  Directed graph source code in the DOT language."""

    Args:
        name: Graph name used in the source code.
        comment: Comment added to the first line of the source.
        filename: Filename for saving the source (defaults to ``name`` + ``'.gv'``).
        directory: (Sub)directory for source saving and rendering.
        format: Rendering output format (``'pdf'``, ``'png'``, ...).
        engine: Layout command used (``'dot'``, ``'neato'``, ...).
        encoding: Encoding for saving the source.
        graph_attr: Mapping of ``(attribute, value)`` pairs for the graph.
        node_attr: Mapping of ``(attribute, value)`` pairs set for all nodes.
        edge_attr: Mapping of ``(attribute, value)`` pairs set for all edges.
        body: Iterable of verbatim lines to add to the graph ``body``.
        strict (bool): Rendering should merge multi-edges.

    Note:
        All parameters are optional and can be changed under their
        corresponding attribute name after instance creation.
    """
digraph.node(‘A’, ‘Dot A’)
创建一个结点的函数

def node(self, name, label=None, _attributes=None, **attrs):

""" Create a node.

Args:
name: 唯一结点标识name  Unique identifier for the node inside the source.
label: Caption to be displayed (defaults to the node ``name``).
attrs: Any additional node attributes (must be strings).
"""
digraph.node(‘A’, ‘Dot A’)
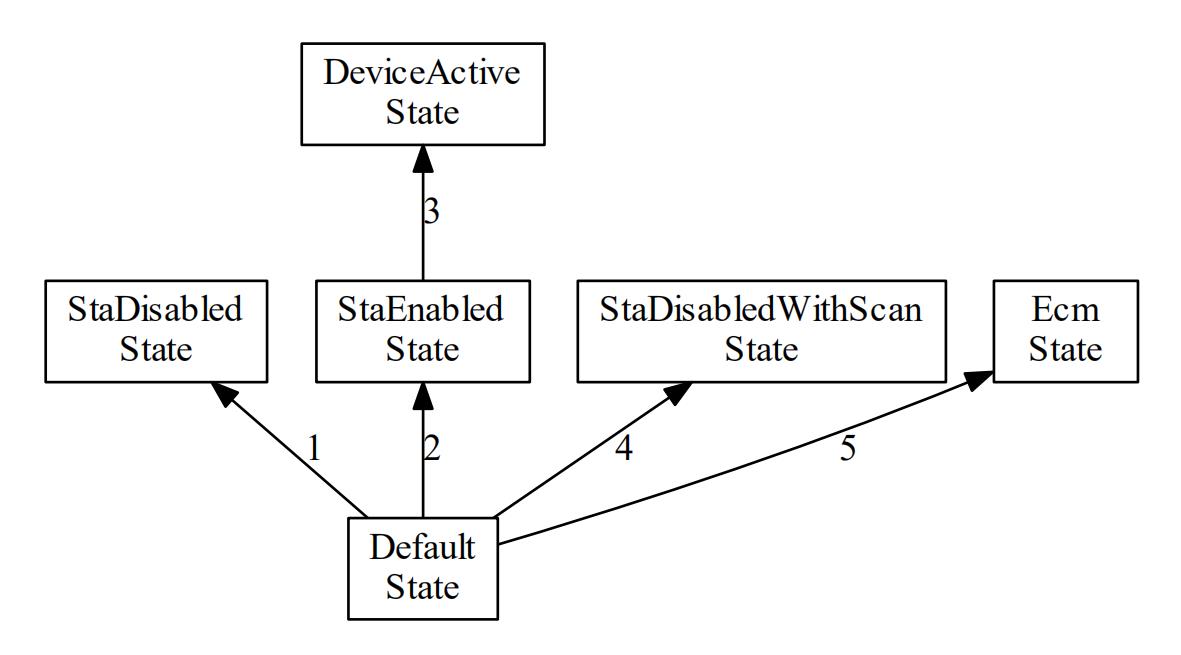
WifiController 状态机切换图


from graphviz import Digraph

if __name__ == '__main__':
    dot = Digraph(comment='record-test')
    dot.graph_attr['rankdir'] = 'BT'
    dot.node('Default', label="Default\nState",shape="box")
    dot.node('StaDisabled', label="StaDisabled\nState",shape="box")
    dot.node('StaEnabled', label="StaEnabled\nState",shape="box" )
    dot.node('DeviceActive', label="DeviceActive\nState",shape="box")
    dot.node('StaDisabledWithScan', label="StaDisabledWithScan\nState",shape="box")
    dot.node('Ecm', label="Ecm\nState",shape="box")

    dot.edge("Default","StaDisabled",label="1")
    dot.edge("Default","StaEnabled",label="2",weight='8')
    dot.edge("Default","StaDisabledWithScan",label="4")
    dot.edge("StaEnabled","DeviceActive",label="3")
    dot.edge("Default","Ecm",label="5")

    print(dot.source)
    print(dot.graph_attr)
    print(dot.node_attr)
    print(dot.edge_attr)
    print(dot.body)
    dot.render('test-output/test-table.gv', view=True)
digraph.node(‘A’, ‘Dot A’,shape=”Mdiamond”)
digraph.node(‘A’, ‘Dot A’,shape=”box”)
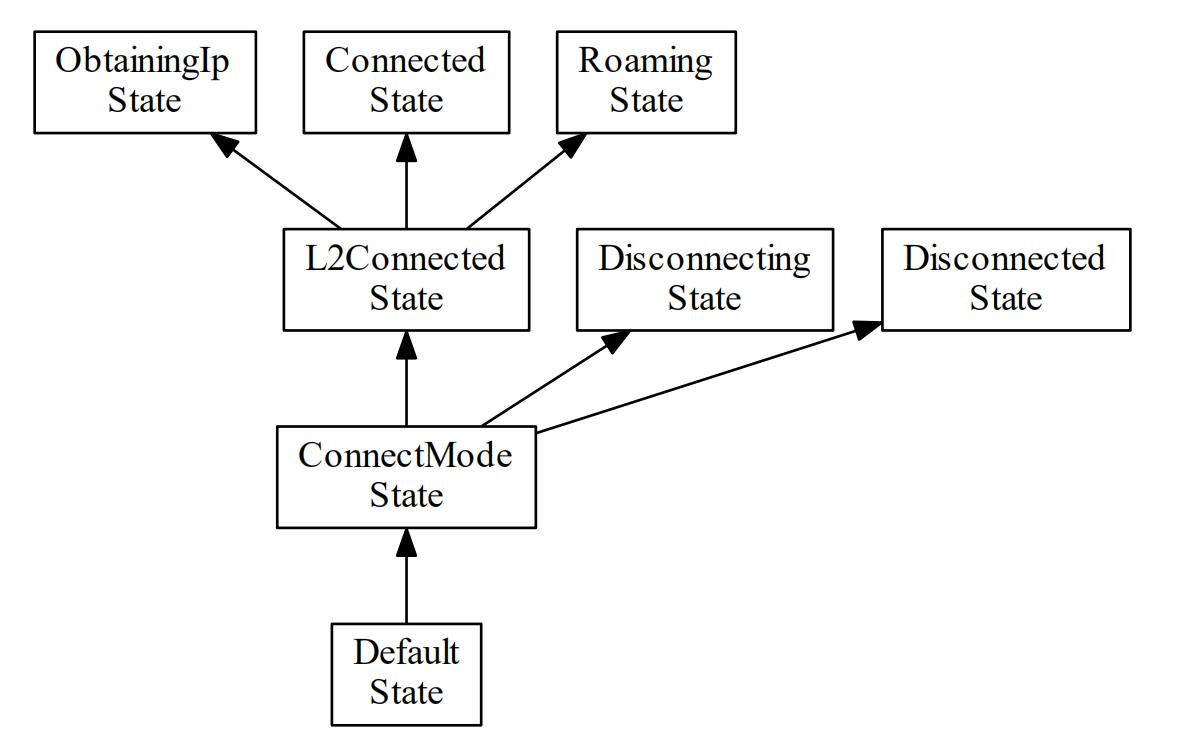
WifiStateMachine 状态机切换图

from graphviz import Digraph

if __name__ == '__main__':
    dot = Digraph(comment='record-test')
    dot.graph_attr['rankdir'] = 'BT'
    dot.node('Default', label="Default\nState",shape="box")
    dot.node('ConnectMode', label="ConnectMode\nState",shape="box")
    dot.node('L2Connected', label="L2Connected\nState",shape="box" )
    dot.node('ObtainingIp', label="ObtainingIp\nState",shape="box")
    dot.node('Connected', label="Connected\nState",shape="box")
    dot.node('Roaming', label="Roaming\nState",shape="box")
    dot.node('Disconnecting', label="Disconnecting\nState",shape="box")
    dot.node('Disconnected', label="Disconnected\nState",shape="box")


    dot.edge("Default","ConnectMode")
    dot.edge("ConnectMode","L2Connected",weight='8')
    dot.edge("ConnectMode","Disconnecting")
    dot.edge("ConnectMode","Disconnected")
    dot.edge("L2Connected","ObtainingIp")
    dot.edge("L2Connected","Connected",weight='2')
    dot.edge("L2Connected","Roaming")

    print(dot.source)
    print(dot.graph_attr)
    print(dot.node_attr)
    print(dot.edge_attr)
    print(dot.body)
    dot.render('test-output/test-table.gv', view=True)
digraph.node(‘A’, ‘Dot A’,shape=”triangle”)
digraph.node(‘A’, ‘Dot A’,shape=”circle”)
digraph.node(‘A’, label=’x1’,shape=”record”)
record 图形用来定义数据结构

from graphviz import Digraph

if __name__ == '__main__':
    dot = Digraph(comment='record-test')
    dot.node('A', label="left|middle|right",shape="record")
    dot.node('B',"hello\nworld|{b|{c|d|e}|f}|g|h",shape="record")
    dot.view()
    print(dot.source)
    print(dot.graph_attr)
    print(dot.node_attr)
    print(dot.edge_attr)
    print(dot.body)
    dot.render('test-output/test-table.gv', view=True)
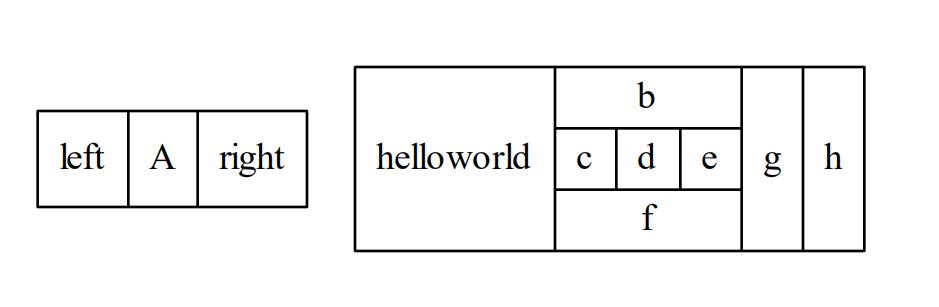
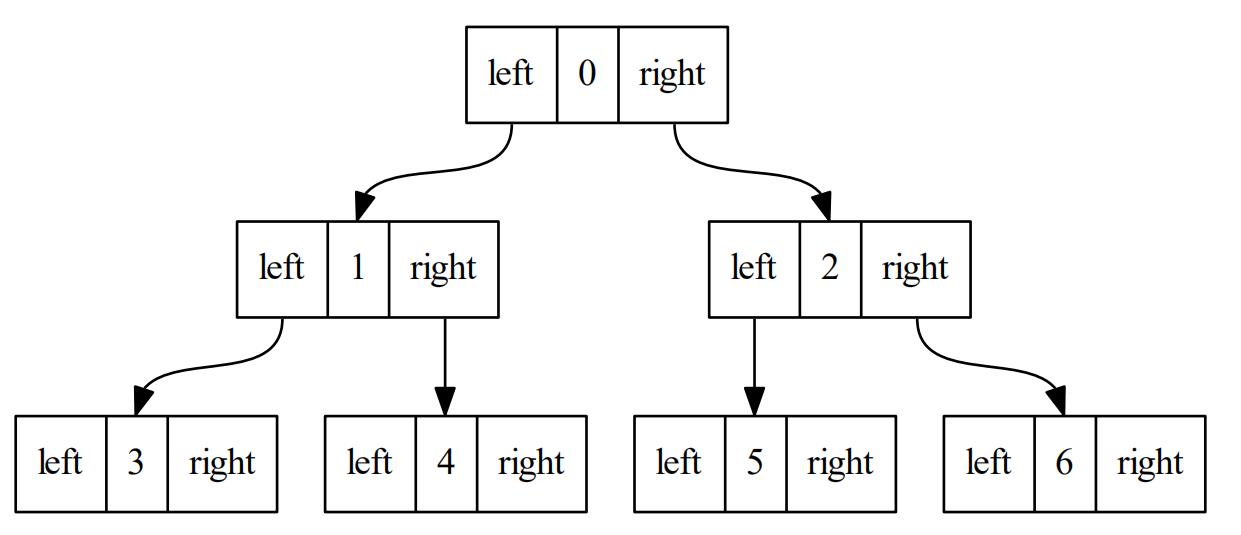
digraph.node(‘A’, label=’left|A|right',shape="record")
使用record图形 来定义 node左右指针结点  连接 0,1,2,3,4,5,6 七个节点

from graphviz import Digraph

if __name__ == '__main__':
    dot = Digraph(comment='record_test')
    dot.node('A', label="<f0>left|<f1>0|<f2>right",shape="record")
    dot.node('B', label="<f0>left|<f1>1|<f2>right",shape="record")
    dot.node('C', label="<f0>left|<f1>2|<f2>right",shape="record")
    dot.node('E', label="<f0>left|<f1>3|<f2>right",shape="record")
    dot.node('F', label="<f0>left|<f1>4|<f2>right",shape="record")
    dot.node('G', label="<f0>left|<f1>5|<f2>right",shape="record")
    dot.node('H', label="<f0>left|<f1>6|<f2>right",shape="record")

    dot.edge('A:f0','B:f1')
    dot.edge('A:f2','C:f1')

    dot.edge('B:f0','E:f1')
    dot.edge('B:f2','F:f1')

    dot.edge('C:f0','G:f1')
    dot.edge('C:f2','H:f1')

    print(dot.source)
    print(dot.graph_attr)
    print(dot.node_attr)
    print(dot.edge_attr)
    print(dot.body)
    dot.render('test-output/test-table.gv', view=True)
digraph.edges([‘AB’, ‘AC’, ‘AB’])
def edges(self, tail_head_iter):
    """Create a bunch of edges.  创建一系列的边

    Args:
        tail_head_iter: Iterable of ``(tail_name, head_name)`` pairs.  【尾结点,头结点】的集合  , 箭头方向是头   尾 --> 头
    """
digraph.edge(‘B’, ‘C’, ‘test’)
    def edge(self, tail_name 尾结点标识, head_name 头结点箭头标识, label=None 箭头上的额外信息, _attributes=None, **attrs):
        """Create an edge between two nodes. 在两个结点之间创建 有向连线

        Args:
            tail_name: Start node identifier.
            head_name: End node identifier.
            label: Caption to be displayed near the edge.
            attrs: Any additional edge attributes (must be strings).
        """
digraph.render(‘test-output/test-table.gv’, view=True)
    def render(self, filename=None, directory=None, view=False, cleanup=False,
               format=None, renderer=None, formatter=None):
        """Save the source to file and render with the Graphviz engine.

        Args:
            filename: Filename for saving the source (defaults to ``name`` + ``'.gv'``)   输出的dot文件名称 .gv
            directory: (Sub)directory for source saving and rendering.      指定路径文件夹  ,如果指定那么文件将保存在该文件夹下
            view (bool): Open the rendered result with the default application. 是否以系统默认打开方式打开 输出的图像
            cleanup (bool): Delete the source file after rendering.
            format: The output format used for rendering (``'pdf'``, ``'png'``, etc.).
            renderer: The output renderer used for rendering (``'cairo'``, ``'gd'``, ...).
            formatter: The output formatter used for rendering (``'cairo'``, ``'gd'``, ...).
        Returns:
            The (possibly relative) path of the rendered file.
        Raises:
            ValueError: If ``format``, ``renderer``, or ``formatter`` are not known.
            graphviz.RequiredArgumentError: If ``formatter`` is given but ``renderer`` is None.
            graphviz.ExecutableNotFound: If the Graphviz executable is not found.
            subprocess.CalledProcessError: If the exit status is non-zero.
            RuntimeError: If viewer opening is requested but not supported.
        """
Digraph属性集合
digraph.str
    def __str__(self):
        """The DOT source code as string."""   图像类的 dot语言源码字符串
        return '\n'.join(self)
digraph.graph_attr
graph_attr: Mapping of ``(attribute, value)`` pairs for the graph.  图像的绘图属性 , 键值对形式存在


digraph.graph_attr['epsilon'] = '0.001'
digraph.graph_attr['style'] = 'filled'
digraph.graph_attr['color'] = 'lightgrey'


print(dot.graph_attr)

输出结果:
{'epsilon': '0.001'}
{'epsilon': '0.001', 'style': 'filled', 'color': 'red'}
图属性 graph_attr 列表
| Name | Default | Values |
|---|---|---|
| bgcolor | background color for drawing, plus initial fill color | |
| center | false | center drawing on page |
| clusterrank | local | may be global or none |
| color | black | for clusters, outline color, and fill color if fillcolor not defined |
| comment | any string (format-dependent) | |
| compound | false | allow edges between clusters |
| concentrate | false | enables edge concentrators |
| fillcolor | black | cluster fill color |
| fontcolor | black | type face color |
| fontname | Times-Roman | font family |
| fontpath | list of directories to search for fonts | |
| fontsize | 14 | point size of label |
| label | any string | |
| labeljust | centered | ”l” and ”r” for left- and right-justified cluster labels, respectively |
| labelloc | top | ”t” and ”b” for top- and bottom-justified cluster labels, respectively |
| layers | id:id:id… | |
| margin | .5 | margin included in page, inches |
| mclimit | 1.0 | scale factor for mincross iterations |
| nodesep | .25 | separation between nodes, in inches. |
| nslimit | if set to f, bounds network simplex iterations by (f)(number of nodes) when setting x-coordinates | |
| nslimit1 | if set to f, bounds network simplex iterations by (f)(number of nodes) when ranking nodes | |
| ordering | if out out edge order is preserved | |
| orientation | portrait | if rotate is not used and the value is landscape, use landscape orientation |
| page | unit of pagination, e.g. “8.5,11” | |
| pagedir | BL | traversal order of pages |
| quantum | if quantum ¿ 0.0, node label dimensions will be rounded to integral multiples of quantum | |
| rank | same, min, max, source or sink | |
| rankdir | TB | LR (left to right) or TB (top to bottom) |
| ranksep | .75 | separation between ranks, in inches. |
| ratio | approximate aspect ratio desired, fill or auto | |
| remincross | if true and there are multiple clusters, re-run crossing minimization | |
| rotate | If 90, set orientation to landscape | |
| samplepoints | 8 | number of points used to represent ellipses and circles on output (cf. Appendix C |
| searchsize | 30 | maximum edges with negative cut values to check when looking for a minimum one during network simplex |
| size | maximum drawing size, in inches | |
| style | graphics options, e.g. filled for clusters | |
| URL | URL associated with graph (format-dependent) |
digraph.graph_attr[null]
digraph.node_attr
node_attr: Mapping of ``(attribute, value)`` pairs set for all nodes. 结点的绘图属性 , 键值对形式存在

digraph.node_attr['style'] = 'filled'
digraph.node_attr['color'] = 'red'


print(dot.node_attr)


输出结果:
{}
{'style': 'filled', 'color': 'red'}
digraph.node_attr node结点属性信息列表
| Name | Default | Values |
|---|---|---|
| color | black | node shape color |
| comment | any string (format-dependent) | |
| distortion | 0.0 | node distortion for shape=polygon |
| fillcolor | lightgrey/black | node fill color |
| fixedsize | false | label text has no affect on node size |
| fontcolor | black | type face color |
| fontname | Times-Roman | font family |
| fontsize | 14 | point size of label |
| group | name of node’s group | |
| height | .5 | height in inches |
| label | node name | any string |
| layer | overlay range | all, id or id:id |
| orientation | 0.0 | node rotation angle |
| peripheries | shape-dependent | number of node boundaries |
| regular | false | force polygon to be regular |
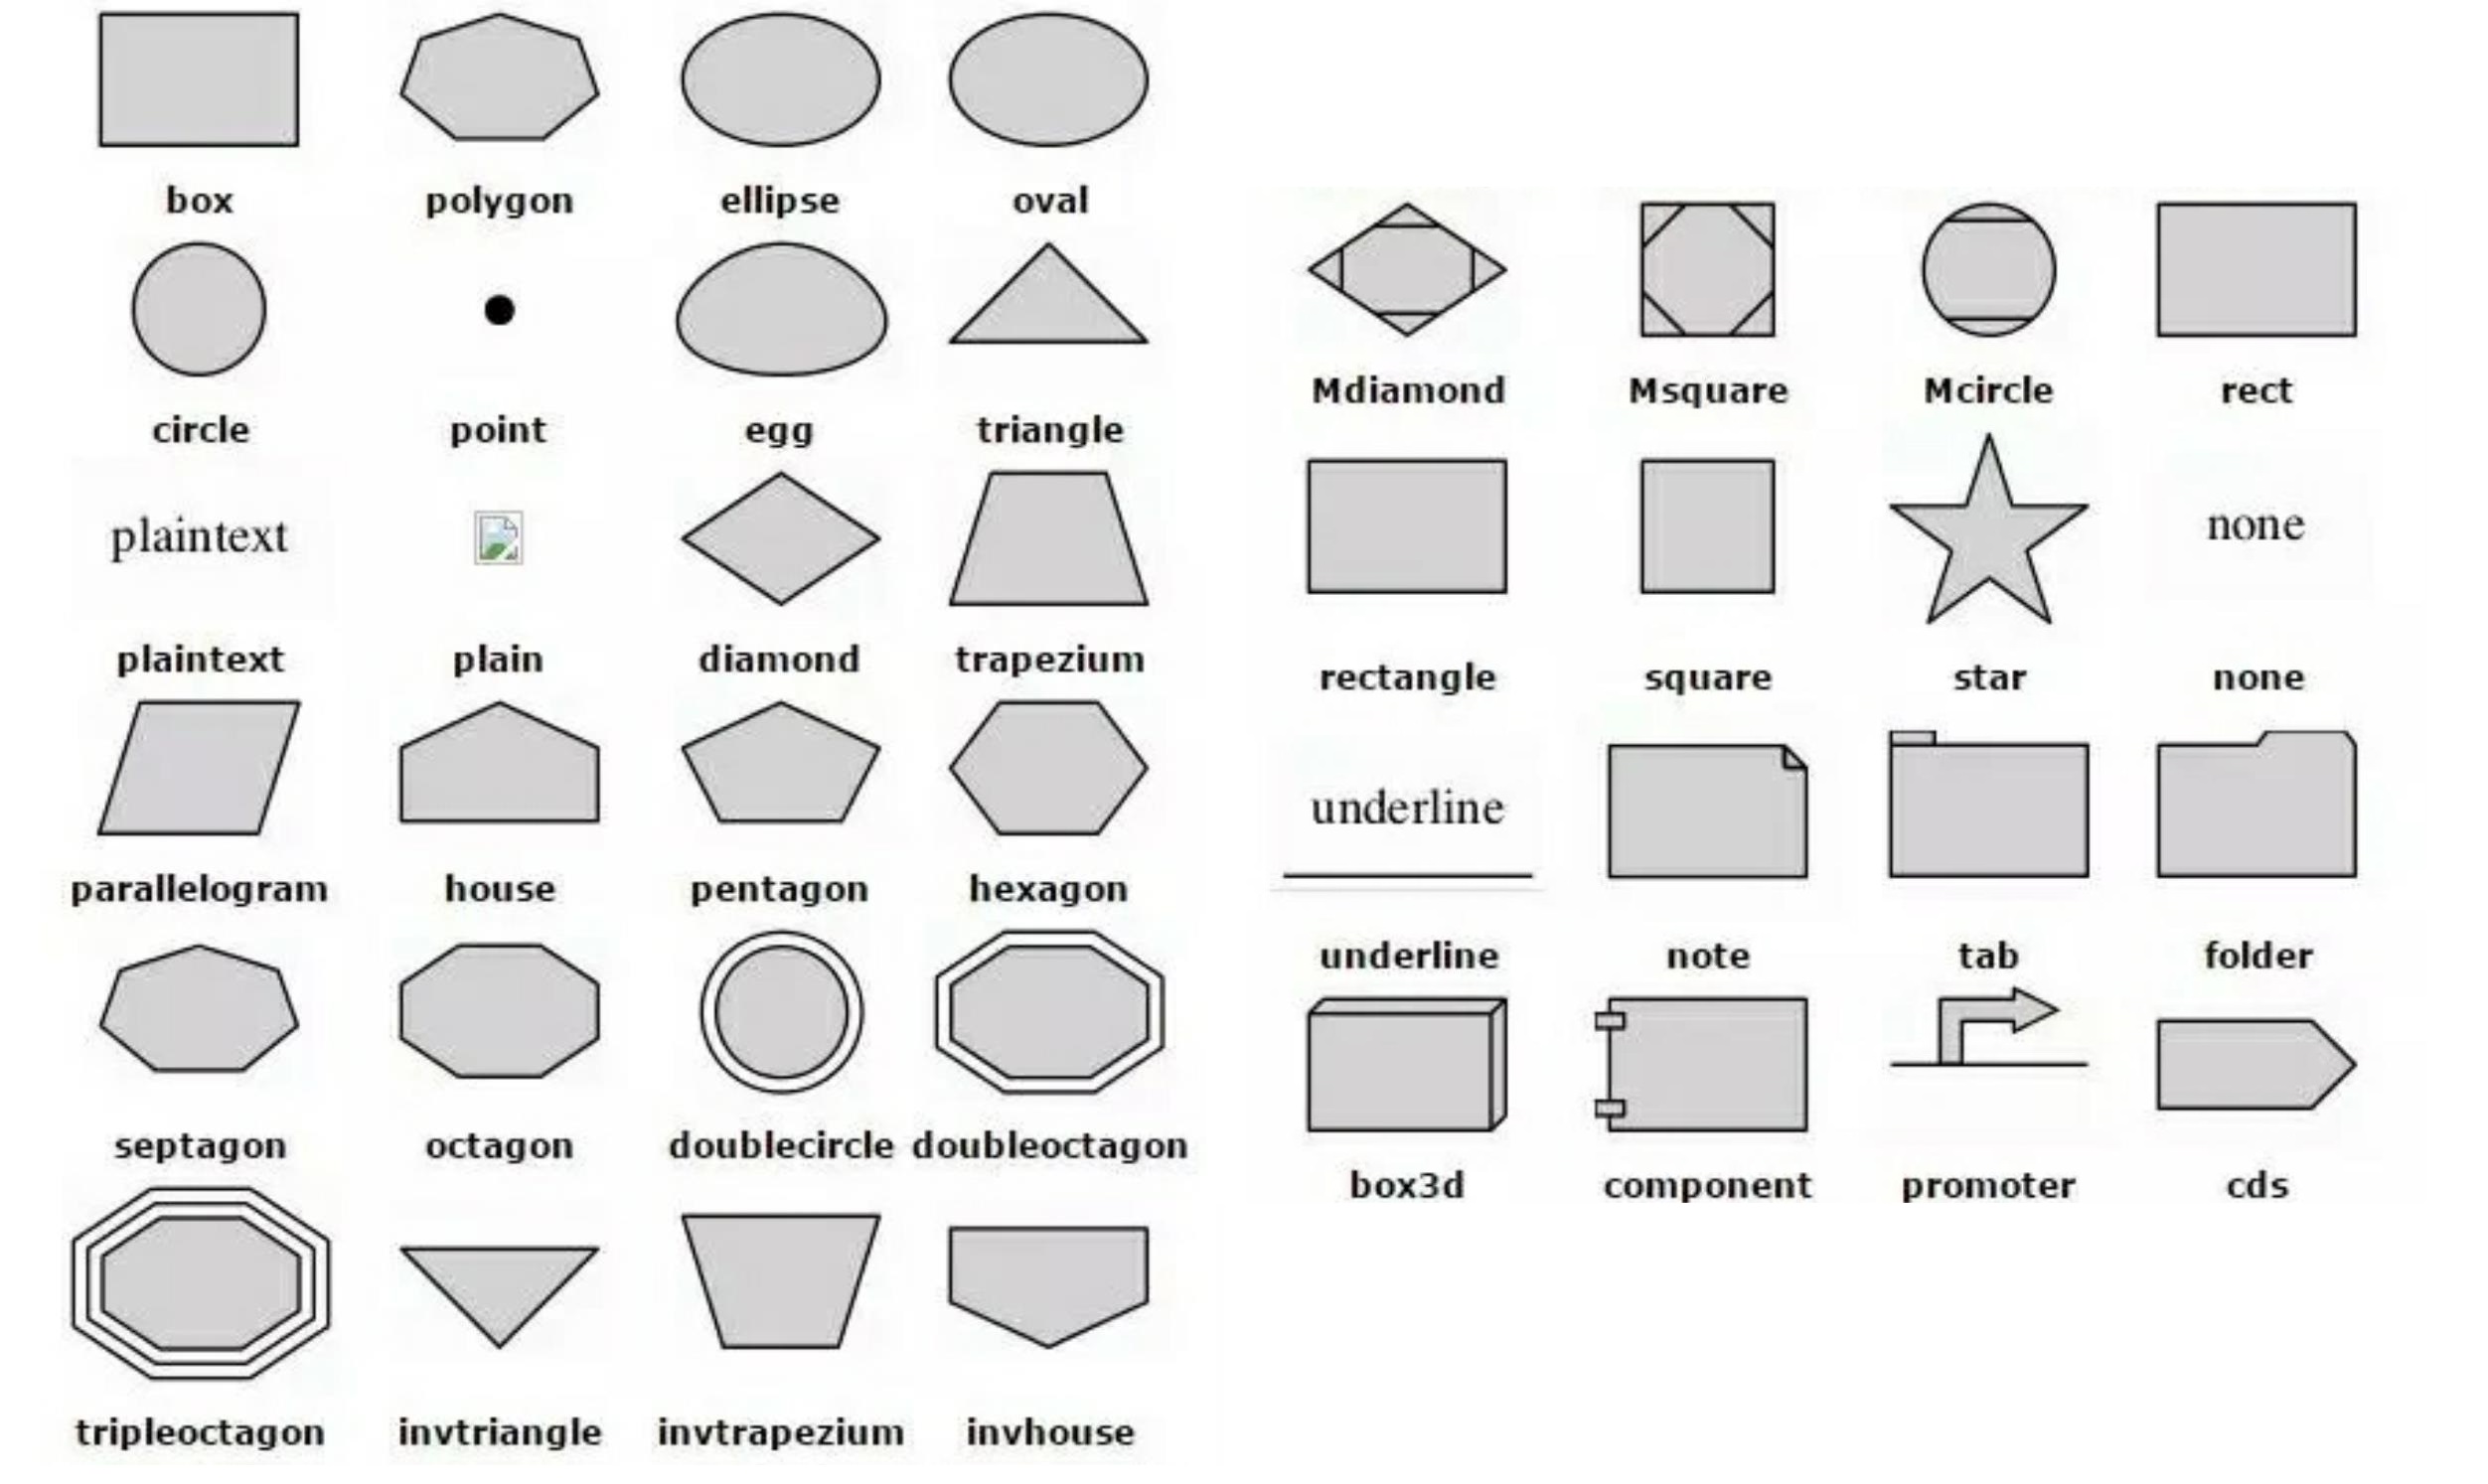
| shape | ellipse | node shape; see Section 2.1 and Appendix E |
| shapefile | external EPSF or SVG custom shape file | |
| sides | 4 | number of sides for shape=polygon |
| skew | 0.0 | skewing of node for shape=polygon |
| style | graphics options, e.g. bold, dotted, filled; cf. Section 2.3 | |
| URL | URL associated with node (format-dependent) | |
| width | .75 | width in inches |
| z | 0.0 | z coordinate for VRML output |
digraph.node_attr{}
digraph.node_attr{‘style’: ‘filled’, ‘color’: ‘red’}
digraph.node_attr['style'] = 'filled'
digraph.node_attr['color'] = 'red'
digraph.node_attr{‘style’: ‘filled’, ‘color’: ‘#FF5588’}
digraph.node_attr['style'] = 'filled'
digraph.node_attr['color'] = 'FF5588'
igraph.node_attr{‘color’: ‘常见值’}
digraph.edge_attr
edge_attr: Mapping of ``(attribute, value)`` pairs set for all edges.

print(dot.edge_attr)

输出结果:
{}
digraph.edge_attr 边属性 信息列表
| Name | Default | Values |
|---|---|---|
| arrowhead | normal | style of arrowhead at head end |
| arrowsize | 1.0 | scaling factor for arrowheads |
| arrowtail | normal | style of arrowhead at tail end |
| color | black | edge stroke color |
| comment | any string (format-dependent) | |
| constraint | true | use edge to affect node ranking |
| decorate | if set, draws a line connecting labels with their edges | |
| dir | forward | forward, back, both, or none |
| fontcolor | black | type face color |
| fontname | Times-Roman | font family |
| fontsize | 14 | point size of label |
| headlabel | label placed near head of edge | |
| headport | n,ne,e,se,s,sw,w,nw 当node为record时指定edge的端口 | |
| headURL | URL attached to head label if output format is ismap | |
| label | edge label | |
| labelangle | -25.0 | angle in degrees which head or tail label is rotated off edge |
| labeldistance | 1.0 | scaling factor for distance of head or tail label from node |
| labelfloat | false | lessen constraints on edge label placement |
| labelfontcolor | black | type face color for head and tail labels |
| labelfontname | Times-Roman | font family for head and tail labels |
| labelfontsize | 14 | point size for head and tail labels |
| layer | overlay range | all, id or id:id |
| lhead | name of cluster to use as head of edge | |
| ltail | name of cluster to use as tail of edge | |
| minlen | 1 | minimum rank distance between head and tail |
| samehead | tag for head node; edge heads with the same tag are | |
| sametail | merged onto the same port | |
| style | tag for tail node; edge tails with the same tag are merged onto the same port | |
| taillabel | graphics options, e.g. bold, dotted, filled; cf. Section 2.3 | |
| tailport | label placed near tail of edge n,ne,e,se,s,sw,w,nw 在PyGraphviz中用来实现nodename:portname的线端指定 | |
| tailURL | URL attached to tail label if output format is ismap | |
| weight | 1 | integer cost of stretching an edge |
digraph.body
body: Iterable of verbatim lines to add to the graph ``body``.


print(dot.body)

输出结果:
['A [label="Dot A"]', 'B [label="Dot B"]', 'C [label="Dot C"]', 'A -> B', 'A -> C', 'A -> B', 'B -> C [label=test]']
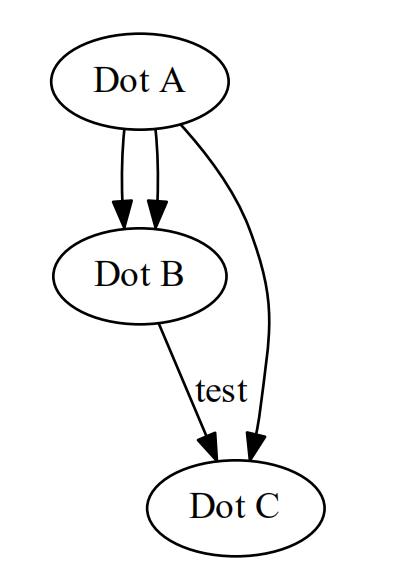
Digraph 有向图_简单绘图_1
1. 导入python 包
from graphviz import Digraph
2. 创建图的类型 ( 有向图 Diagraph )
3. 在图中创建 点
4. 定义点之间的关系
5. 输出关系图
from graphviz import Digraph
if __name__ == '__main__':
dot = Digraph(name='Digraph1', comment = 'testDigraph_1')
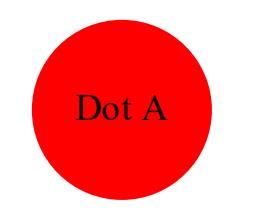
# 添加圆点A,A的标签是Dot A
dot.node('A', 'Dot A')
# 添加圆点 B, B的标签是Dot B
dot.node('B', 'Dot B')
# dot.view()
# 添加圆点 C, C的标签是Dot C
dot.node('C', 'Dot C')
# dot.view()
# 创建一堆边,即连接AB的两条边,连接AC的一条边。
dot.edges(['AB', 'AC', 'AB'])
# dot.view()
# 在创建两圆点之间创建一条边
dot.edge('B', 'C', 'test')
# dot.view()
# 获取DOT source源码的字符串形式
print(dot.source)
# 保存source到文件,并提供Graphviz引擎
dot.render('test-output/test-table.gv', view=True)
输出结果:

digraph {
	A [label="Dot A"]
	B [label="Dot B"]
	C [label="Dot C"]
	A -> B
	A -> C
	A -> B
	B -> C [label=test]
}
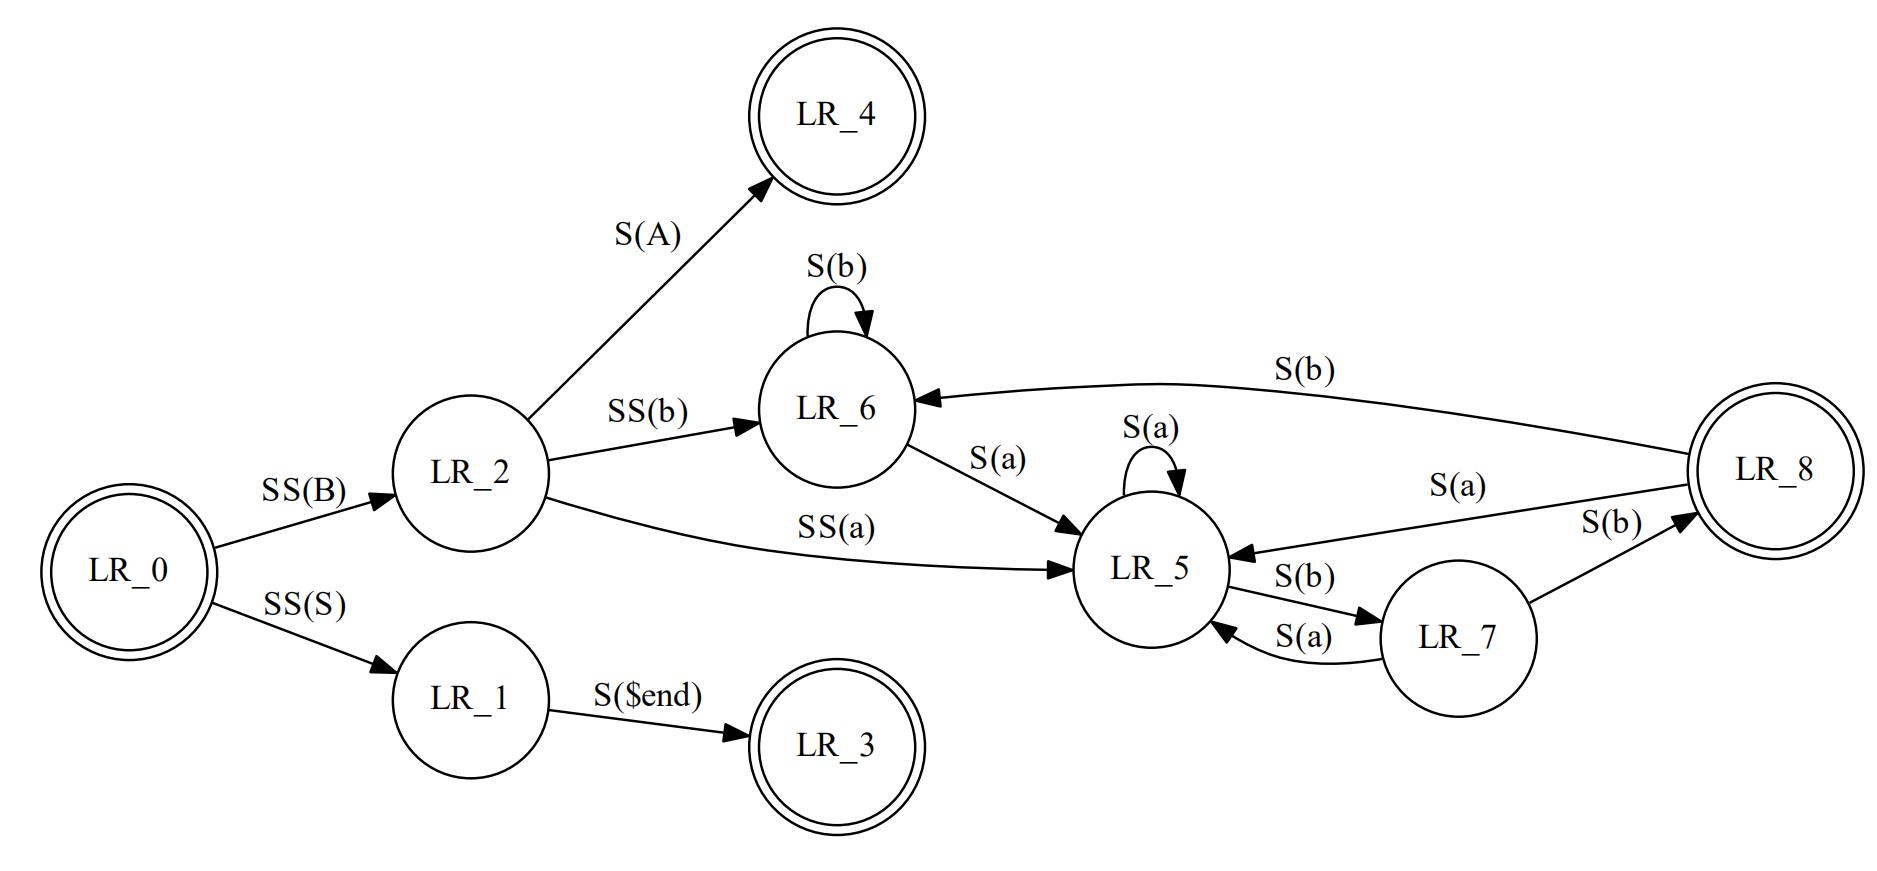
Digraph 有向图_简单绘图_2
from graphviz import Digraph

f = Digraph('finite_state_machine', filename='fsm.gv')
f.attr(rankdir='LR', size='8,5')

f.attr('node', shape='doublecircle')
f.node('LR_0')
f.node('LR_3')
f.node('LR_4')
f.node('LR_8')

f.attr('node', shape='circle')
f.edge('LR_0', 'LR_2', label='SS(B)')
f.edge('LR_0', 'LR_1', label='SS(S)')
f.edge('LR_1', 'LR_3', label='S($end)')
f.edge('LR_2', 'LR_6', label='SS(b)')
f.edge('LR_2', 'LR_5', label='SS(a)')
f.edge('LR_2', 'LR_4', label='S(A)')
f.edge('LR_5', 'LR_7', label='S(b)')
f.edge('LR_5', 'LR_5', label='S(a)')
f.edge('LR_6', 'LR_6', label='S(b)')
f.edge('LR_6', 'LR_5', label='S(a)')
f.edge('LR_7', 'LR_8', label='S(b)')
f.edge('LR_7', 'LR_5', label='S(a)')
f.edge('LR_8', 'LR_6', label='S(b)')
f.edge('LR_8', 'LR_5', label='S(a)')

f.view()
print(f.source)
digraph finite_state_machine {
	rankdir=LR size="8,5"
	node [shape=doublecircle]
	LR_0
	LR_3
	LR_4
	LR_8
	node [shape=circle]
	LR_0 -> LR_2 [label="SS(B)"]
	LR_0 -> LR_1 [label="SS(S)"]
	LR_1 -> LR_3 [label="S($end)"]
	LR_2 -> LR_6 [label="SS(b)"]
	LR_2 -> LR_5 [label="SS(a)"]
	LR_2 -> LR_4 [label="S(A)"]
	LR_5 -> LR_7 [label="S(b)"]
	LR_5 -> LR_5 [label="S(a)"]
	LR_6 -> LR_6 [label="S(b)"]
	LR_6 -> LR_5 [label="S(a)"]
	LR_7 -> LR_8 [label="S(b)"]
	LR_7 -> LR_5 [label="S(a)"]
	LR_8 -> LR_6 [label="S(b)"]
	LR_8 -> LR_5 [label="S(a)"]
}
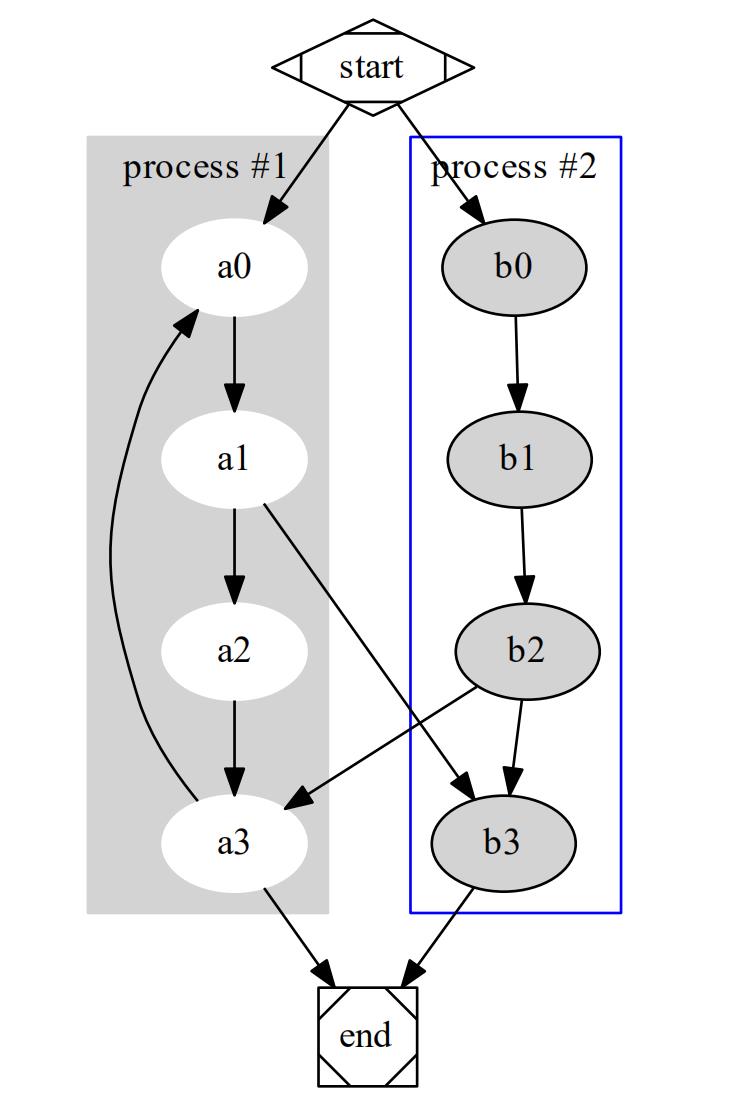
Digraph 有向图_集群_3
from graphviz import Digraph

g = Digraph('G', filename='cluster.gv')

# NOTE: the subgraph name needs to begin with 'cluster' (all lowercase)
#       so that Graphviz recognizes it as a special cluster subgraph

with g.subgraph(name='cluster_0') as c:
    c.attr(style='filled')
    c.attr(color='lightgrey')
    c.node_attr.update(style='filled', color='white')
    c.edges([('a0', 'a1'), ('a1', 'a2'), ('a2', 'a3')])
    c.attr(label='process #1')

with g.subgraph(name='cluster_1') as c:
    c.node_attr.update(style='filled')
    c.edges([('b0', 'b1'), ('b1', 'b2'), ('b2', 'b3')])
    c.attr(label='process #2')
    c.attr(color='blue')

g.edge('start', 'a0')
g.edge('start', 'b0')
g.edge('a1', 'b3')
g.edge('b2', 'a3')
g.edge('a3', 'a0')
g.edge('a3', 'end')
g.edge('b3', 'end')

g.node('start', shape='Mdiamond')
g.node('end', shape='Msquare')

g.view()
print(g.source)
digraph G {
	subgraph cluster_0 {
		node [color=white style=filled]
		style=filled
		color=lightgrey
		a0 -> a1
		a1 -> a2
		a2 -> a3
		label="process #1"
	}
	subgraph cluster_1 {
		node [style=filled]
		b0 -> b1
		b1 -> b2
		b2 -> b3
		label="process #2"
		color=blue
	}
	start -> a0
	start -> b0
	a1 -> b3
	b2 -> a3
	a3 -> a0
	a3 -> end
	b3 -> end
	start [shape=Mdiamond]
	end [shape=Msquare]
}
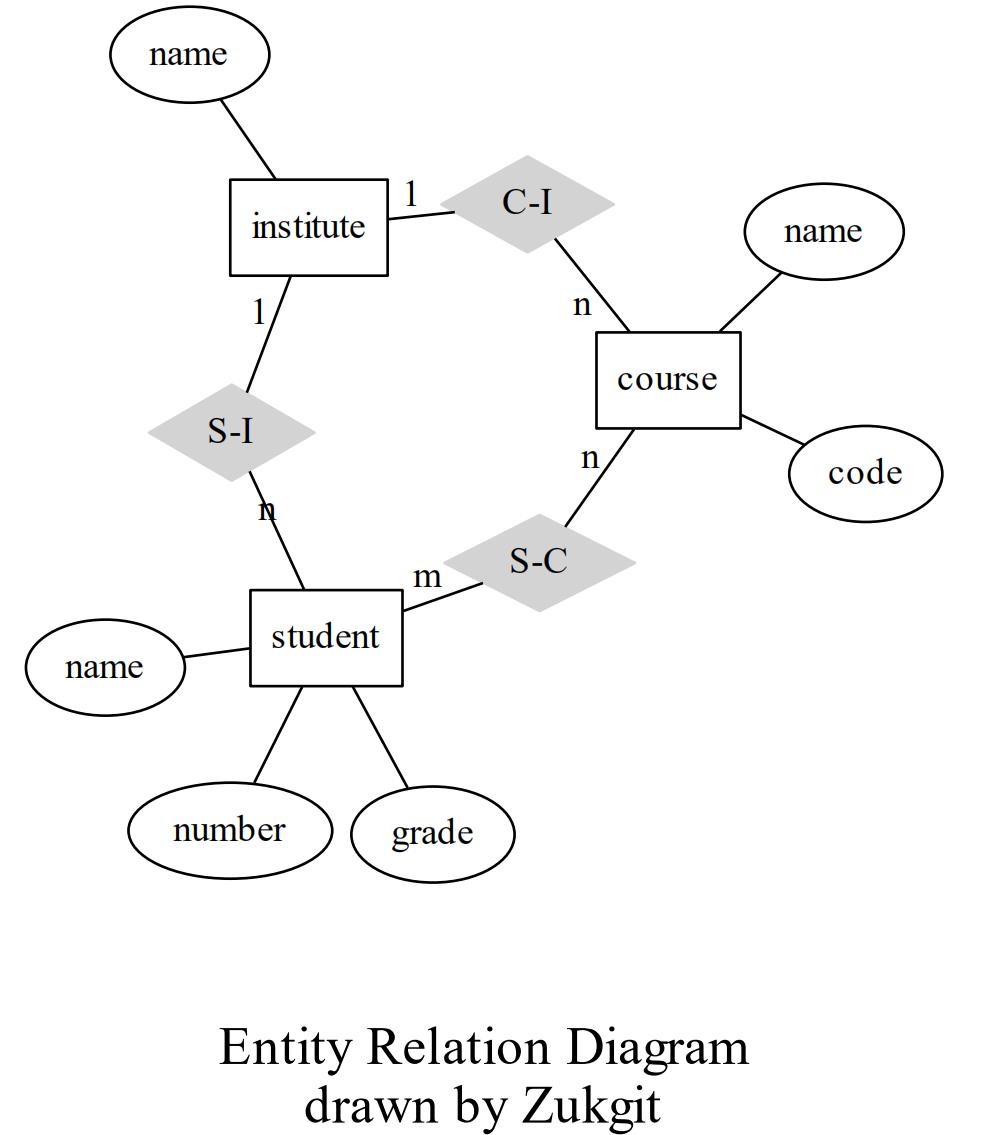
Digraph 有向图_实例关系ER图_4
# er.py - http://www.graphviz.org/content/ER

from graphviz import Graph

e = Graph('ER', filename='er.gv', engine='neato')

e.attr('node', shape='box')
e.node('course')
e.node('institute')
e.node('student')

e.attr('node', shape='ellipse')
e.node('name0', label='name')
e.node('name1', label='name')
e.node('name2', label='name')
e.node('code')
e.node('grade')
e.node('number')

e.attr('node', shape='diamond', style='filled', color='lightgrey')
e.node('C-I')
e.node('S-C')
e.node('S-I')

e.edge('name0', 'course')
e.edge('code', 'course')
e.edge('course', 'C-I', label='n', len='1.00')
e.edge('C-I', 'institute', label='1', len='1.00')
e.edge('institute', 'name1')
e.edge('institute', 'S-I', label='1', len='1.00')
e.edge('S-I', 'student', label='n', len='1.00')
e.edge('student', 'grade')
e.edge('student', 'name2')
e.edge('student', 'number')
e.edge('student', 'S-C', label='m', len='1.00')
e.edge('S-C', 'course', label='n', len='1.00')

e.attr(label=r'\n\nEntity Relation Diagram\ndrawn by Zukgit')
e.attr(fontsize='20')

e.view()
print(e.source)
graph ER {
	node [shape=box]
	course
	institute
	student
	node [shape=ellipse]
	name0 [label=name]
	name1 [label=name]
	name2 [label=name]
	code
	grade
	number
	node [color=lightgrey shape=diamond style=filled]
	"C-I"
	"S-C"
	"S-I"
	name0 -- course
	code -- course
	course -- "C-I" [label=n len=1.00]
	"C-I" -- institute [label=1 len=1.00]
	institute -- name1
	institute -- "S-I" [label=1 len=1.00]
	"S-I" -- student [label=n len=1.00]
	student -- grade
	student -- name2
	student -- number
	student -- "S-C" [label=m len=1.00]
	"S-C" -- course [label=n len=1.00]
	label="\n\nEntity Relation Diagram\ndrawn by Zukgit"
	fontsize=20
}
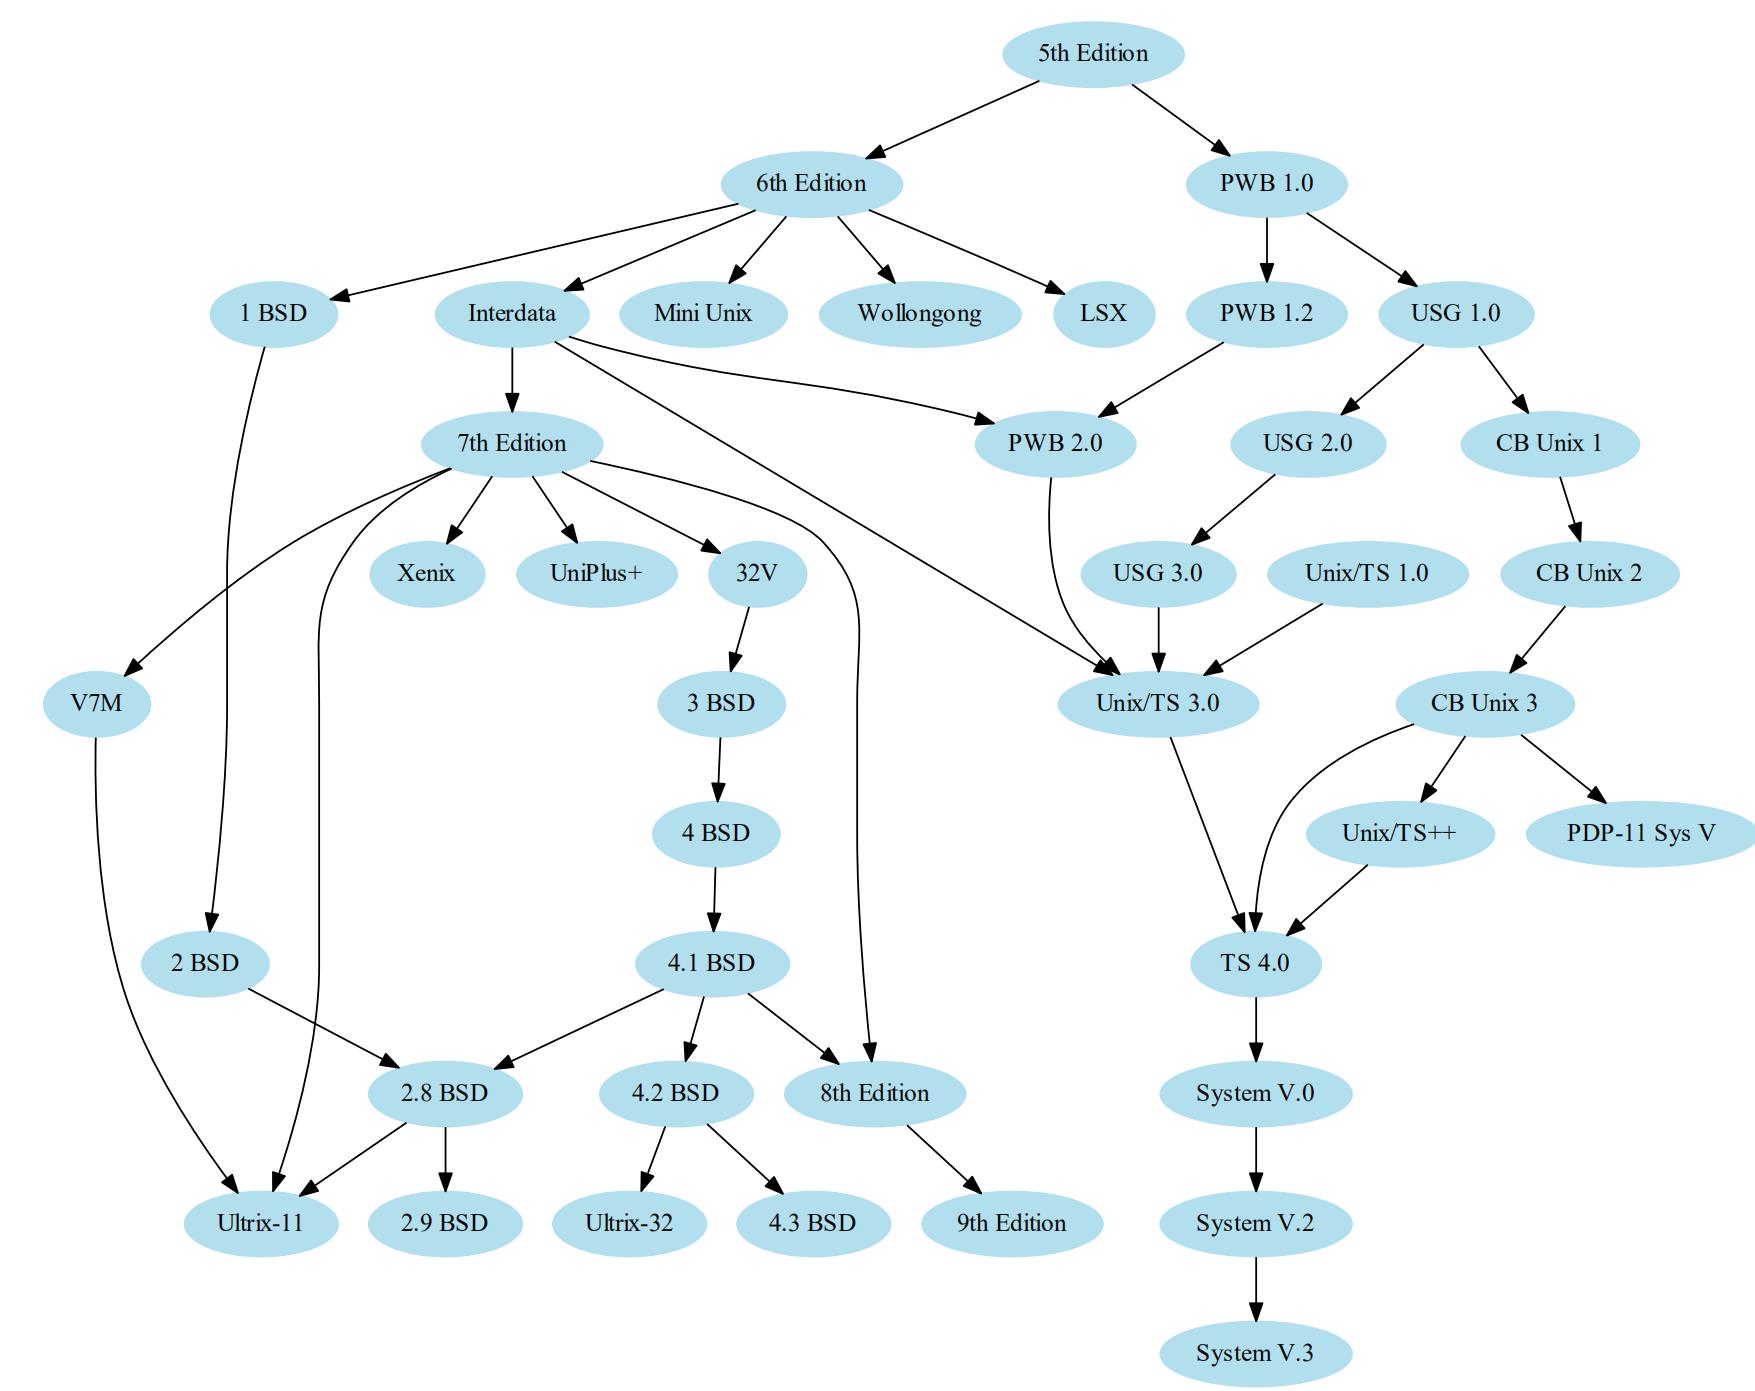
Digraph 有向图_迭代继承图_5
# unix.py - http://www.graphviz.org/content/unix

from graphviz import Digraph

u = Digraph('unix', filename='unix.gv')
u.attr(size='6,6')
u.node_attr.update(color='lightblue2', style='filled')

u.edge('5th Edition', '6th Edition')
u.edge('5th Edition', 'PWB 1.0')
u.edge('6th Edition', 'LSX')
u.edge('6th Edition', '1 BSD')
u.edge('6th Edition', 'Mini Unix')
u.edge('6th Edition', 'Wollongong')
u.edge('6th Edition', 'Interdata')
u.edge('Interdata', 'Unix/TS 3.0')
u.edge('Interdata', 'PWB 2.0')
u.edge('Interdata', '7th Edition')
u.edge('7th Edition', '8th Edition')
u.edge('7th Edition', '32V')
u.edge('7th Edition', 'V7M')
u.edge('7th Edition', 'Ultrix-11')
u.edge('7th Edition', 'Xenix')
u.edge('7th Edition', 'UniPlus+')
u.edge('V7M', 'Ultrix-11')
u.edge('8th Edition', '9th Edition')
u.edge('1 BSD', '2 BSD')
u.edge('2 BSD', '2.8 BSD')
u.edge('2.8 BSD', 'Ultrix-11')
u.edge('2.8 BSD', '2.9 BSD')
u.edge('32V', '3 BSD')
u.edge('3 BSD', '4 BSD')
u.edge('4 BSD', '4.1 BSD')
u.edge('4.1 BSD', '4.2 BSD')
u.edge('4.1 BSD', '2.8 BSD')
u.edge('4.1 BSD', '8th Edition')
u.edge('4.2 BSD', '4.3 BSD')
u.edge('4.2 BSD', 'Ultrix-32')
u.edge('PWB 1.0', 'PWB 1.2')
u.edge('PWB 1.0', 'USG 1.0')
u.edge('PWB 1.2', 'PWB 2.0')
u.edge('USG 1.0', 'CB Unix 1')
u.edge('USG 1.0', 'USG 2.0')
u.edge('CB Unix 1', 'CB Unix 2')
u.edge('CB Unix 2', 'CB Unix 3')
u.edge('CB Unix 3', 'Unix/TS++')
u.edge('CB Unix 3', 'PDP-11 Sys V')
u.edge('USG 2.0', 'USG 3.0')
u.edge('USG 3.0', 'Unix/TS 3.0')
u.edge('PWB 2.0', 'Unix/TS 3.0')
u.edge('Unix/TS 1.0', 'Unix/TS 3.0')
u.edge('Unix/TS 3.0', 'TS 4.0')
u.edge('Unix/TS++', 'TS 4.0')
u.edge('CB Unix 3', 'TS 4.0')
u.edge('TS 4.0', 'System V.0')
u.edge('System V.0', 'System V.2')
u.edge('System V.2', 'System V.3')

u.view()
print(u.source)
digraph unix {
	node [color=lightblue2 style=filled]
	size="6,6"
	"5th Edition" -> "6th Edition"
	"5th Edition" -> "PWB 1.0"
	"6th Edition" -> LSX
	"6th Edition" -> "1 BSD"
	"6th Edition" -> "Mini Unix"
	"6th Edition" -> Wollongong
	"6th Edition" -> Interdata
	Interdata -> "Unix/TS 3.0"
	Interdata -> "PWB 2.0"
	Interdata -> "7th Edition"
	"7th Edition" -> "8th Edition"
	"7th Edition" -> "32V"
	"7th Edition" -> V7M
	"7th Edition" -> "Ultrix-11"
	"7th Edition" -> Xenix
	"7th Edition" -> "UniPlus+"
	V7M -> "Ultrix-11"
	"8th Edition" -> "9th Edition"
	"1 BSD" -> "2 BSD"
	"2 BSD" -> "2.8 BSD"
	"2.8 BSD" -> "Ultrix-11"
	"2.8 BSD" -> "2.9 BSD"
	"32V" -> "3 BSD"
	"3 BSD" -> "4 BSD"
	"4 BSD" -> "4.1 BSD"
	"4.1 BSD" -> "4.2 BSD"
	"4.1 BSD" -> "2.8 BSD"
	"4.1 BSD" -> "8th Edition"
	"4.2 BSD" -> "4.3 BSD"
	"4.2 BSD" -> "Ultrix-32"
	"PWB 1.0" -> "PWB 1.2"
	"PWB 1.0" -> "USG 1.0"
	"PWB 1.2" -> "PWB 2.0"
	"USG 1.0" -> "CB Unix 1"
	"USG 1.0" -> "USG 2.0"
	"CB Unix 1" -> "CB Unix 2"
	"CB Unix 2" -> "CB Unix 3"
	"CB Unix 3" -> "Unix/TS++"
	"CB Unix 3" -> "PDP-11 Sys V"
	"USG 2.0" -> "USG 3.0"
	"USG 3.0" -> "Unix/TS 3.0"
	"PWB 2.0" -> "Unix/TS 3.0"
	"Unix/TS 1.0" -> "Unix/TS 3.0"
	"Unix/TS 3.0" -> "TS 4.0"
	"Unix/TS++" -> "TS 4.0"
	"CB Unix 3" -> "TS 4.0"
	"TS 4.0" -> "System V.0"
	"System V.0" -> "System V.2"
	"System V.2" -> "System V.3"
}
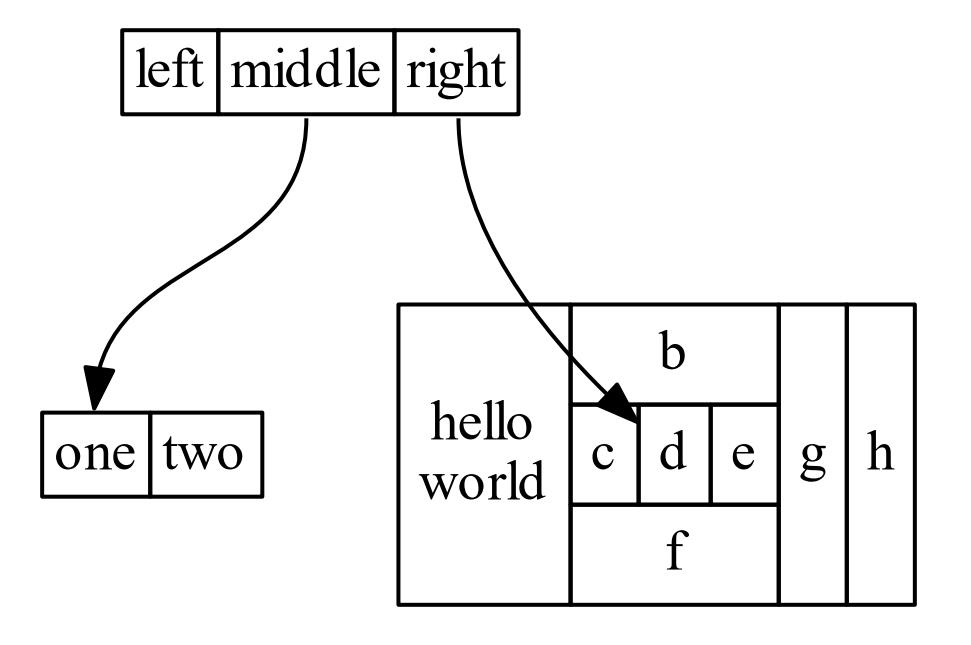
Digraph 有向图_数据结构图_6
# structs.py - http://www.graphviz.org/doc/info/shapes.html#html

from graphviz import Digraph

s = Digraph('structs', node_attr={'shape': 'plaintext'})

s.node('struct1', '''<
<TABLE BORDER="0" CELLBORDER="1" CELLSPACING="0">
  <TR>
    <TD>left</TD>
    <TD PORT="f1">middle</TD>
    <TD PORT="f2">right</TD>
  </TR>
</TABLE>>''')
s.node('struct2', '''<
<TABLE BORDER="0" CELLBORDER="1" CELLSPACING="0">
  <TR>
    <TD PORT="f0">one</TD>
    <TD>two</TD>
  </TR>
</TABLE>>''')
s.node('struct3', '''<
<TABLE BORDER="0" CELLBORDER="1" CELLSPACING="0" CELLPADDING="4">
  <TR>
    <TD ROWSPAN="3">hello<BR/>world</TD>
    <TD COLSPAN="3">b</TD>
    <TD ROWSPAN="3">g</TD>
    <TD ROWSPAN="3">h</TD>
  </TR>
  <TR>
    <TD>c</TD>
    <TD PORT="here">d</TD>
    <TD>e</TD>
  </TR>
  <TR>
    <TD COLSPAN="3">f</TD>
  </TR>
</TABLE>>''')

s.edges([('struct1:f1', 'struct2:f0'), ('struct1:f2', 'struct3:here')])       # 指定了 连接的 Port

s.view()
print(s.source)
digraph structs {
	node [shape=plaintext]
	struct1 [label=<
<TABLE BORDER="0" CELLBORDER="1" CELLSPACING="0">
  <TR>
    <TD>left</TD>
    <TD PORT="f1">middle</TD>
    <TD PORT="f2">right</TD>
  </TR>
</TABLE>>]
	struct2 [label=<
<TABLE BORDER="0" CELLBORDER="1" CELLSPACING="0">
  <TR>
    <TD PORT="f0">one</TD>
    <TD>two</TD>
  </TR>
</TABLE>>]
	struct3 [label=<
<TABLE BORDER="0" CELLBORDER="1" CELLSPACING="0" CELLPADDING="4">
  <TR>
    <TD ROWSPAN="3">hello<BR/>world</TD>
    <TD COLSPAN="3">b</TD>
    <TD ROWSPAN="3">g</TD>
    <TD ROWSPAN="3">h</TD>
  </TR>
  <TR>
    <TD>c</TD>
    <TD PORT="here">d</TD>
    <TD>e</TD>
  </TR>
  <TR>
    <TD COLSPAN="3">f</TD>
  </TR>
</TABLE>>]
	struct1:f1 -> struct2:f0
	struct1:f2 -> struct3:here
}
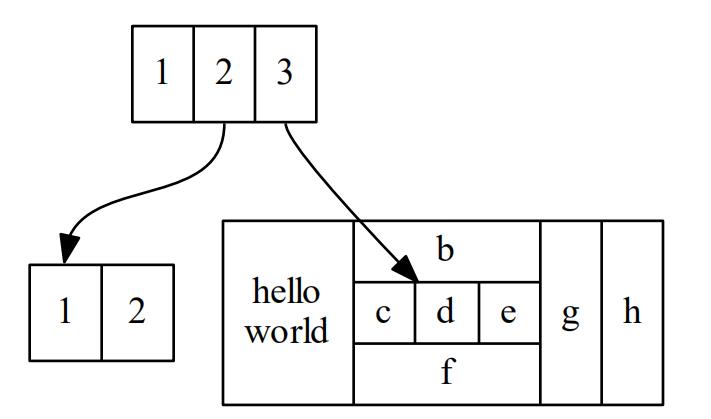
Digraph 有向图_数据结构快速原型图_7
from graphviz import Digraph

s = Digraph('structs', filename='structs_revisited.gv', node_attr={'shape': 'record'})

s.node('struct1', '<f0> 1|<f1> 2|<f2> 3')
s.node('struct2', '<f0> 1|<f1> 2')
s.node('struct3', r'hello\nworld |{ b |{c|<here> d|e}| f}| g | h')

s.edges([('struct1:f1', 'struct2:f0'), ('struct1:f2', 'struct3:here')])

s.view()
print(s.source)
digraph structs {
	node [shape=record]
	struct1 [label="<f0> 1|<f1> 2|<f2> 3"]
	struct2 [label="<f0> 1|<f1> 2"]
	struct3 [label="hello\nworld |{ b |{c|<here> d|e}| f}| g | h"]
	struct1:f1 -> struct2:f0
	struct1:f2 -> struct3:here
}
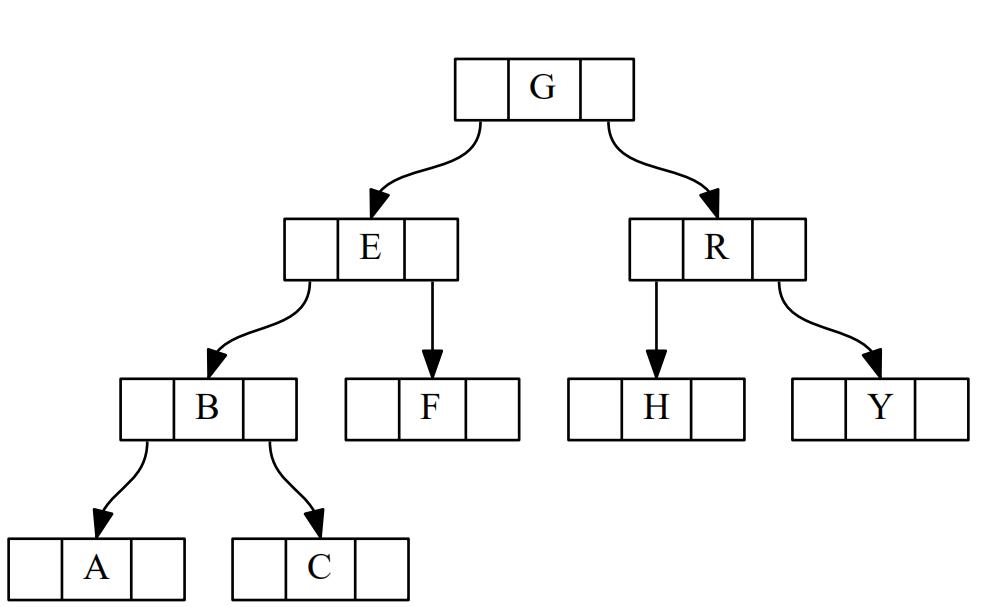
Digraph 有向图_二叉树图_8
from graphviz import Digraph, nohtml

g = Digraph('g', filename='btree.gv', node_attr={'shape': 'record', 'height': '.1'})

g.node('node0', nohtml('<f0> |<f1> G|<f2>'))
g.node('node1', nohtml('<f0> |<f1> E|<f2>'))
g.node('node2', nohtml('<f0> |<f1> B|<f2>'))
g.node('node3', nohtml('<f0> |<f1> F|<f2>'))
g.node('node4', nohtml('<f0> |<f1> R|<f2>'))
g.node('node5', nohtml('<f0> |<f1> H|<f2>'))
g.node('node6', nohtml('<f0> |<f1> Y|<f2>'))
g.node('node7', nohtml('<f0> |<f1> A|<f2>'))
g.node('node8', nohtml('<f0> |<f1> C|<f2>'))

g.edge('node0:f2', 'node4:f1')
g.edge('node0:f0', 'node1:f1')
g.edge('node1:f0', 'node2:f1')
g.edge('node1:f2', 'node3:f1')
g.edge('node2:f2', 'node8:f1')
g.edge('node2:f0', 'node7:f1')
g.edge('node4:f2', 'node6:f1')
g.edge('node4:f0', 'node5:f1')

g.view()
digraph g {
	node [height=.1 shape=record]
	node0 [label="<f0> |<f1> G|<f2>"]
	node1 [label="<f0> |<f1> E|<f2>"]
	node2 [label="<f0> |<f1> B|<f2>"]
	node3 [label="<f0> |<f1> F|<f2>"]
	node4 [label="<f0> |<f1> R|<f2>"]
	node5 [label="<f0> |<f1> H|<f2>"]
	node6 [label="<f0> |<f1> Y|<f2>"]
	node7 [label="<f0> |<f1> A|<f2>"]
	node8 [label="<f0> |<f1> C|<f2>"]
	node0:f2 -> node4:f1
	node0:f0 -> node1:f1
	node1:f0 -> node2:f1
	node1:f2 -> node3:f1
	node2:f2 -> node8:f1
	node2:f0 -> node7:f1
	node4:f2 -> node6:f1
	node4:f0 -> node5:f1
}
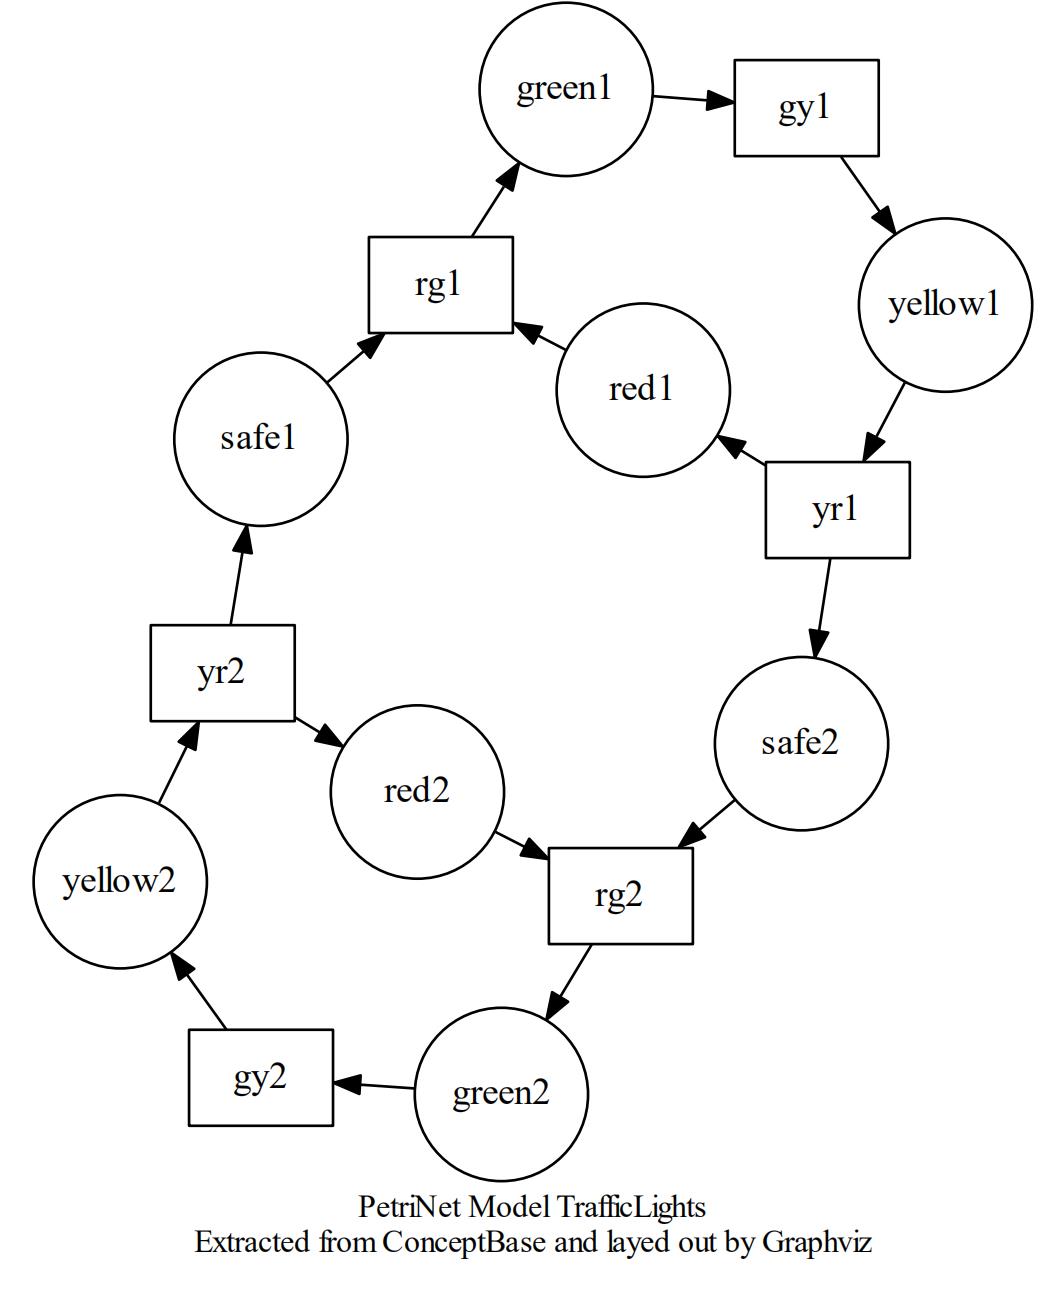
Digraph 有向图_环图_9
from graphviz import Digraph

t = Digraph('TrafficLights', filename='traffic_lights.gv', engine='neato')

t.attr('node', shape='box')
for i in (2, 1):
    t.node('gy%d' % i)
    t.node('yr%d' % i)
    t.node('rg%d' % i)

t.attr('node', shape='circle', fixedsize='true', width='0.9')
for i in (2, 1):
    t.node('green%d' % i)
    t.node('yellow%d' % i)
    t.node('red%d' % i)
    t.node('safe%d' % i)

for i, j in [(2, 1), (1, 2)]:
    t.edge('gy%d' % i, 'yellow%d' % i)
    t.edge('rg%d' % i, 'green%d' % i)
    t.edge('yr%d' % i, 'safe%d' % j)
    t.edge('yr%d' % i, 'red%d' % i)
    t.edge('safe%d' % i, 'rg%d' % i)
    t.edge('green%d' % i, 'gy%d' % i)
    t.edge('yellow%d' % i, 'yr%d' % i)
    t.edge('red%d' % i, 'rg%d' % i)

t.attr(overlap='false')
t.attr(label=r'PetriNet Model TrafficLights\n'
             r'Extracted from ConceptBase and layed out by Graphviz')
t.attr(fontsize='12')

t.view()
print(t.source)
digraph TrafficLights {
	node [shape=box]
	gy2
	yr2
	rg2
	gy1
	yr1
	rg1
	node [fixedsize=true shape=circle width=0.9]
	green2
	yellow2
	red2
	safe2
	green1
	yellow1
	red1
	safe1
	gy2 -> yellow2
	rg2 -> green2
	yr2 -> safe1
	yr2 -> red2
	safe2 -> rg2
	green2 -> gy2
	yellow2 -> yr2
	red2 -> rg2
	gy1 -> yellow1
	rg1 -> green1
	yr1 -> safe2
	yr1 -> red1
	safe1 -> rg1
	green1 -> gy1
	yellow1 -> yr1
	red1 -> rg1
	overlap=false
	label="PetriNet Model TrafficLights\nExtracted from ConceptBase and layed out by Graphviz"
	fontsize=12
}
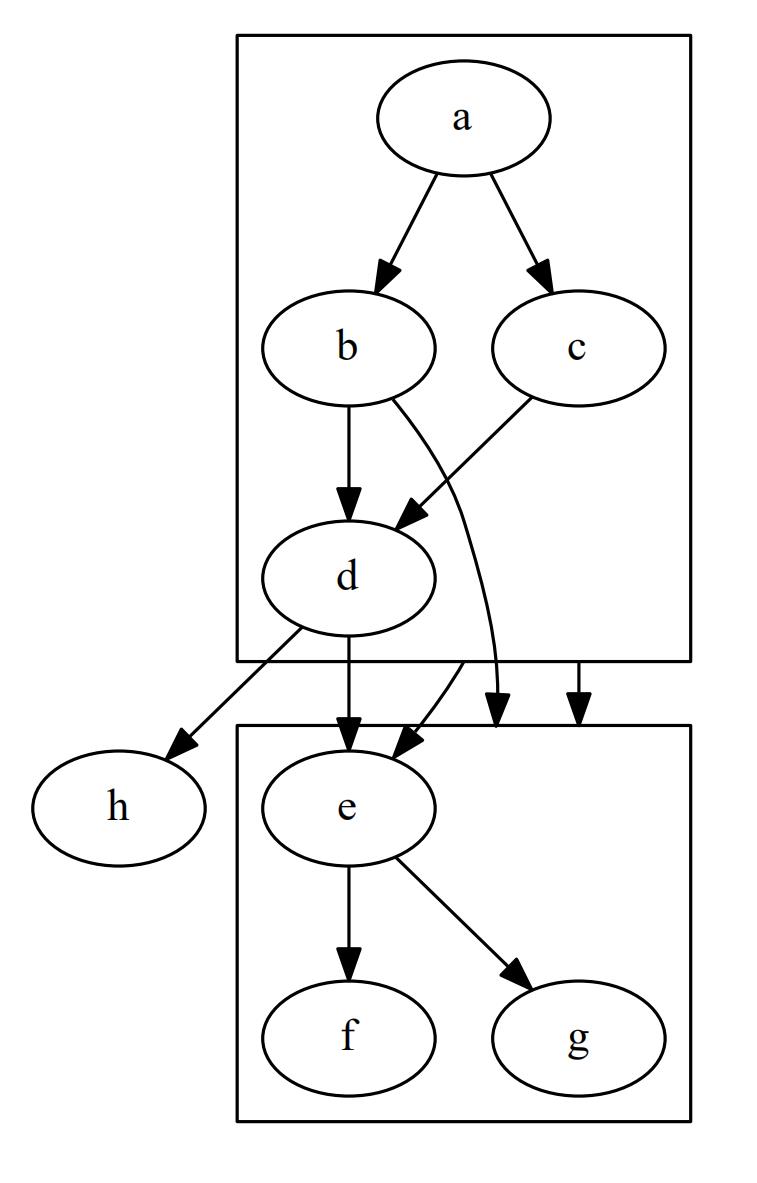
Digraph 有向图_集群有向图_10
from graphviz import Digraph

g = Digraph('G', filename='cluster_edge.gv')
g.attr(compound='true')

with g.subgraph(name='cluster0') as c:
    c.edges(['ab', 'ac', 'bd', 'cd'])

with g.subgraph(name='cluster1') as c:
    c.edges(['eg', 'ef'])

g.edge('b', 'f', lhead='cluster1')
g.edge('d', 'e')
g.edge('c', 'g', ltail='cluster0', lhead='cluster1')
g.edge('c', 'e', ltail='cluster0')
g.edge('d', 'h')

g.view()
print(g.source)
digraph G {
	compound=true
	subgraph cluster0 {
		a -> b
		a -> c
		b -> d
		c -> d
	}
	subgraph cluster1 {
		e -> g
		e -> f
	}
	b -> f [lhead=cluster1]
	d -> e
	c -> g [lhead=cluster1 ltail=cluster0]
	c -> e [ltail=cluster0]
	d -> h
}
Graph无向图
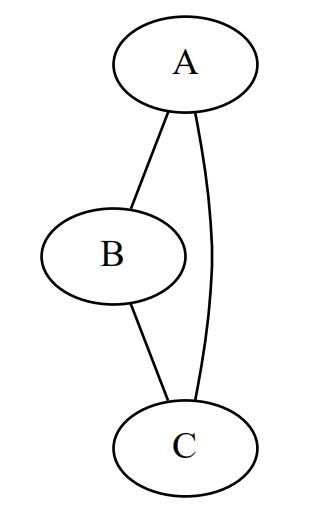
Graph无向图_简单绘制_1
from graphviz import Graph

if __name__ == '__main__':
    dot = Graph(comment='Graph')
    dot.node('A', 'A')               ## 定义node节点  node( name 定义点的名字必须唯一, label 显示的lable )
    dot.node('B', 'B')
    dot.node('C', 'C')
    dot.edges(['AB', 'AC', 'BC'])         ## 定义node节点的边  tail_head_iter标识node节点组合 dot.edges(['AB', 'AC', 'BC'])     def edges(self, tail_head_iter):
    print(dot.source)                     ##  打印该构建代码的 dot语言的 代码格式
    dot.render('test-output/test_graph.gv', view=True)          ## 生成并显示 生成的 无向图


输出结果:

graph {
	A [label=A]
	B [label=B]
	C [label=C]
	A -- B
	A -- C
	B -- C
}
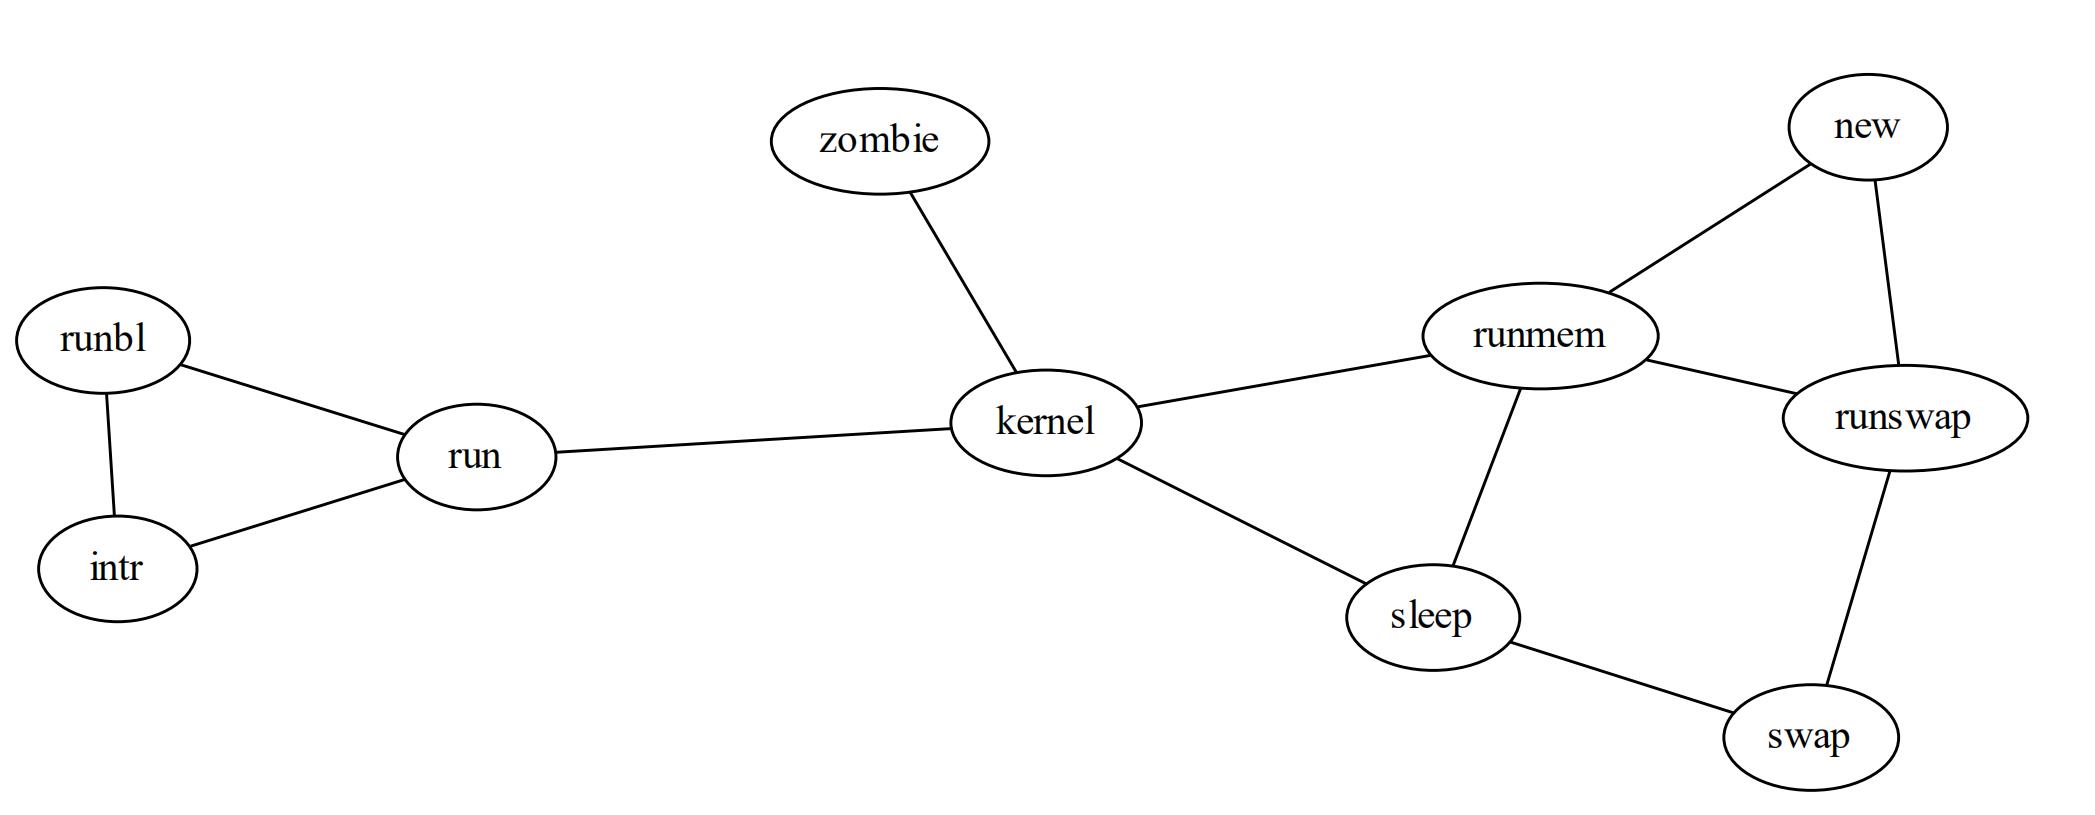
Graph无向图_简单绘制_2
from graphviz import Graph

g = Graph('G', filename='process.gv', engine='sfdp')

g.edge('run', 'intr')
g.edge('intr', 'runbl')
g.edge('runbl', 'run')
g.edge('run', 'kernel')
g.edge('kernel', 'zombie')
g.edge('kernel', 'sleep')
g.edge('kernel', 'runmem')
g.edge('sleep', 'swap')
g.edge('swap', 'runswap')
g.edge('runswap', 'new')
g.edge('runswap', 'runmem')
g.edge('new', 'runmem')
g.edge('sleep', 'runmem')

g.view()
print(g.source)
// dot 源码
graph G {
	run -- intr
	intr -- runbl
	runbl -- run
	run -- kernel
	kernel -- zombie
	kernel -- sleep
	kernel -- runmem
	sleep -- swap
	swap -- runswap
	runswap -- new
	runswap -- runmem
	new -- runmem
	sleep -- runmem
}
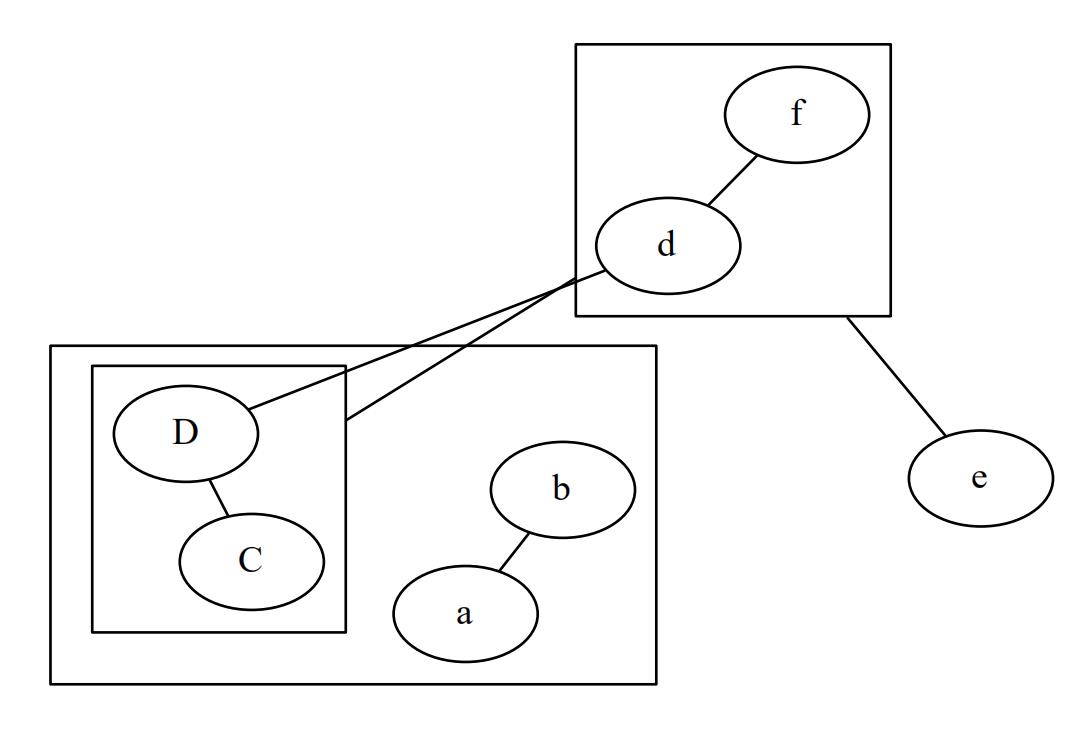
Graph无向图_集群图_3
from graphviz import Graph

g = Graph('G', filename='fdpclust.gv', engine='fdp')

g.node('e')

with g.subgraph(name='clusterA') as a:
    a.edge('a', 'b')
    with a.subgraph(name='clusterC') as c:
        c.edge('C', 'D')

with g.subgraph(name='clusterB') as b:
    b.edge('d', 'f')

g.edge('d', 'D')
g.edge('e', 'clusterB')
g.edge('clusterC', 'clusterB')

g.view()
print(g.source)
graph G {
	e
	subgraph clusterA {
		a -- b
		subgraph clusterC {
			C -- D
		}
	}
	subgraph clusterB {
		d -- f
	}
	d -- D
	e -- clusterB
	clusterC -- clusterB
}
安卓状态机图形
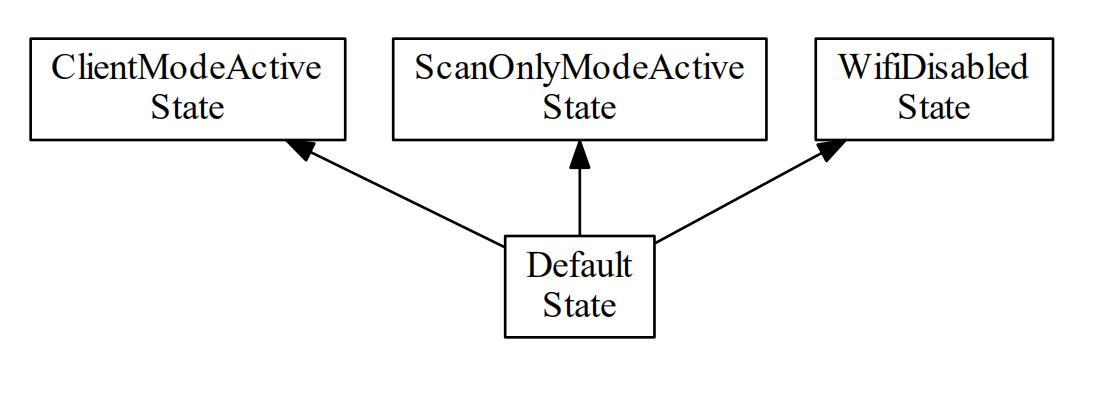
WifiStateMachinePrime.ModeStateMachine  状态机

addState(mDefault);
addState(mClientModeActiveState);
addState(mScanOnlyModeActiveState);
addState(mWifiDisabledState);


from graphviz import Digraph

if __name__ == '__main__':
    dot = Digraph(comment='record-test')
    dot.graph_attr['rankdir'] = 'BT'

    dot.node('Default', label="Default\nState",shape="box" )
    dot.node('ClientModeActive', label="ClientModeActive\nState",shape="box")
    dot.node('ScanOnlyModeActive', label="ScanOnlyModeActive\nState",shape="box")
    dot.node('WifiDisabled', label="WifiDisabled\nState",shape="box" )

    dot.edge("Default","ClientModeActive")
    dot.edge("Default","ScanOnlyModeActive")
    dot.edge("Default","WifiDisabled")


    print(dot.source)
    print(dot.graph_attr)
    print(dot.node_attr)
    print(dot.edge_attr)
    print(dot.body)
    dot.render('test-output/test-table.gv', view=True)